Handbook / STS — the Sage Trading System
Step 1: Where — find the level
Use Volume Profile to find the prices where the market did the most trading.
In one sentence
Volume Profile shows where the most trading happened, and those prices are where you look for trades.
Why it matters
Price does not move at random between all levels. It often reacts where lots of trading happened before. Those are the "where" of STS.
If you trade in the middle of nowhere, you have nothing to lean on. Your stop has no clear place to go.
Do this
Mark these levels before the market opens. Use yesterday's session.
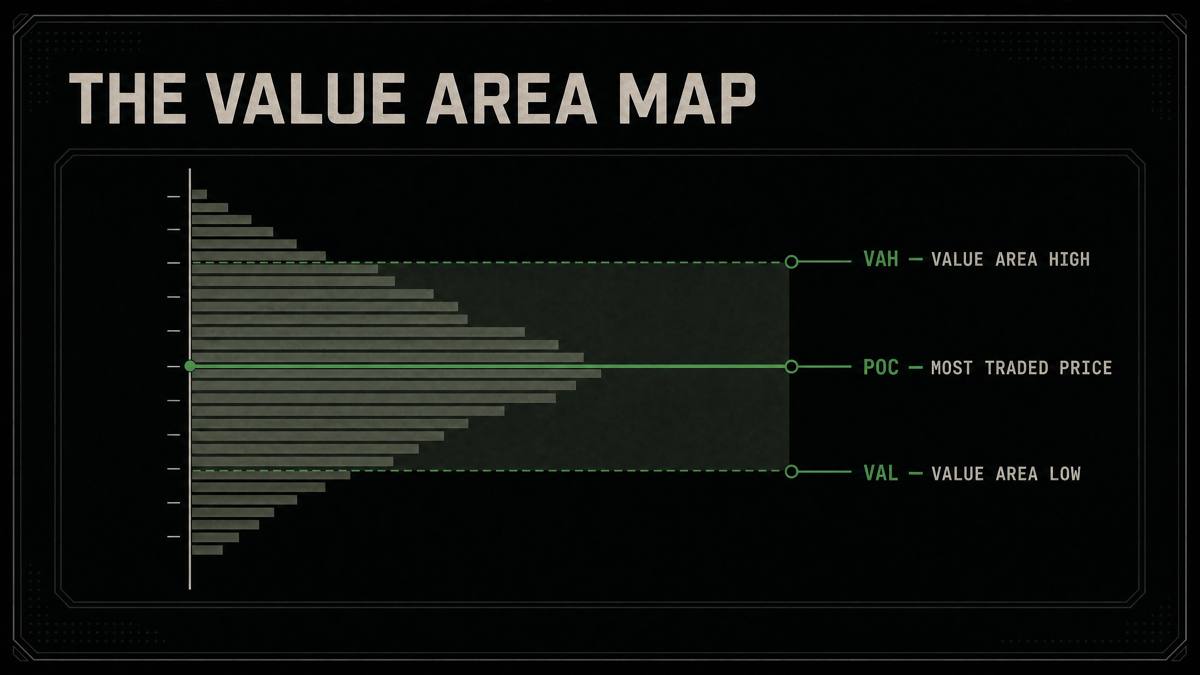
- POC (point of control). The single price with the most trading. Think of it as the fair price the market agreed on.
- VAH and VAL (value area high and low). The top and bottom of the zone where about 70% of the trading happened.
- Demand and supply zones. Areas with a lot of past trading below the POC (demand) or above it (supply).
- Naked POCs. Past POCs that price has not gone back to yet. Price often returns to them.
- Draw a line at each level. Then wait for price to come to one of them.
Real example
This diagram shows the value area: VAH on top, POC in the middle, VAL on the bottom. It is a teaching diagram, not a real trade.
See the full Volume Profile manual for more.
Common mistakes
- Marking levels after the trade. Mark them before the open, so you do not bend them to fit.
- Treating a level as a promise. A level is a place to watch, not a sure bounce.
- Marking too many lines. Keep the few that matter most: POC, VAH, VAL and the main zones.