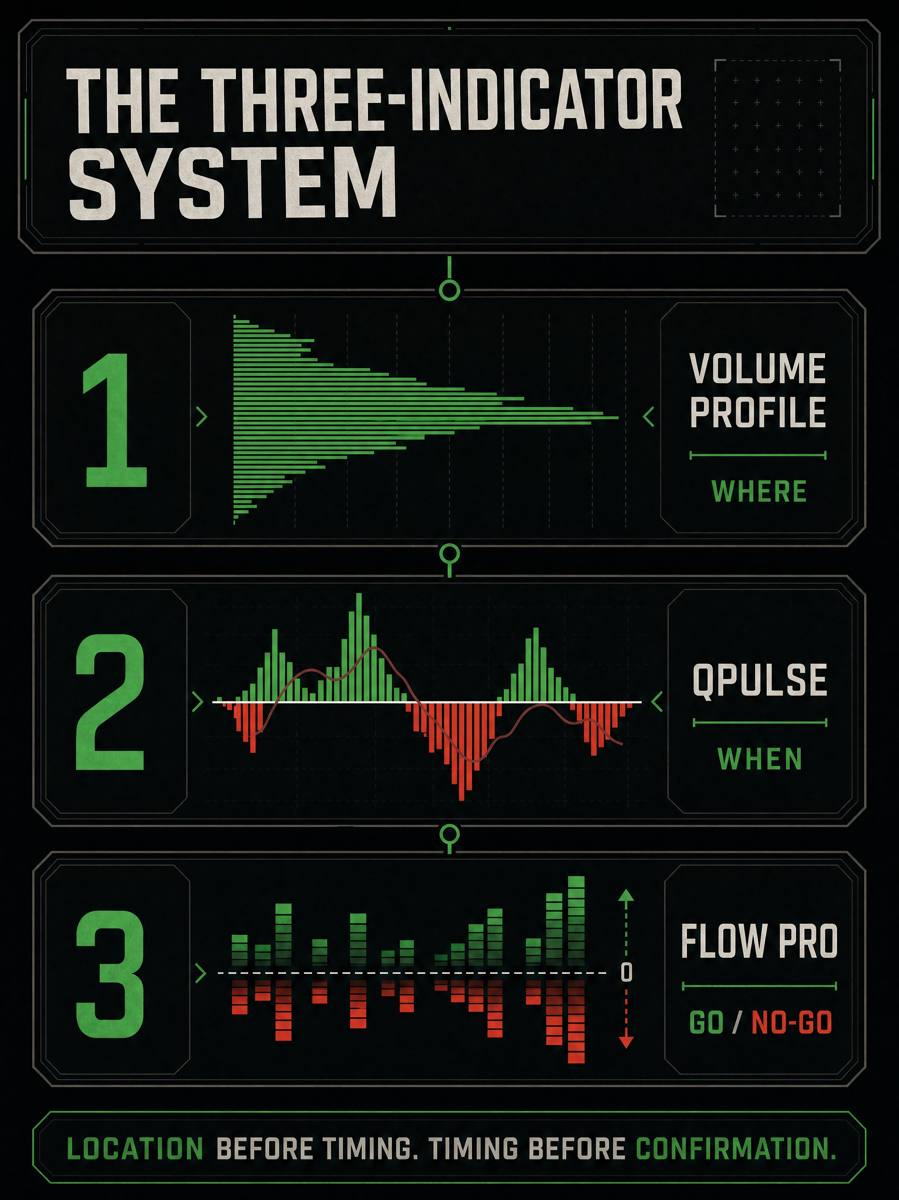
Start with the core three
The core stack answers location, timing, and participation in that order.
Official TradingView registry
Open the original publication before you add a script. The registry preserves the exact public title, source URL, access label, handbook mapping, and any identity or version issue found during the August 24, 2026 audit.
20 currently published scripts
Read-only audit of the rendered Nexural profile and every linked publication page. The snapshot records public titles, URLs, access labels, visible descriptions, and identity drift; it does not inspect protected Pine source.
Nexural MTF Pro
Brings up to three higher-timeframe candles, confirmed structure, market phase, session rails, and decision context into the execution chart.
Nexural Delta Trend
Combines an adaptive trend engine with lower-timeframe volume-delta confirmation in one price overlay.
Nexural Volume Profile
Maps auction value, volume nodes, session structure, zones, and acceptance or rejection across price.
Nexural Trend Finder
Shows dual-JMA trend turns, a lower-timeframe participation estimate, ATR context, and a compact regime dashboard.
Nexural Imbalance Pro
Separates buy and sell pressure, adds a net-pressure line, and visualizes dominance, balance, and participation.
Nexural Pressure Pro
Publishes pressure, imbalance, net-control, and market-state logic under the long-running Pressure Pro page identity.
Nexural Flow Pro
Separates estimated buying and selling volume to show dominance, imbalance, session delta, activity, and chop.
Nexural QWAP
Adds intrabar volume decomposition, CVD context, adaptive deviation bands, and pattern labels to session VWAP.
Nexural ORB
Tracks several opening ranges, historical levels, confluence, quality context, breaks, reclaims, and extensions.
Nexural Fisher Pro
Adapts the Fisher Transform with dominant-cycle measurement, bounded normalization, smoothing, and regime context.
Nexural OrderFlow Matrix
Organizes estimated up/down volume, delta, CVD, VWAP, and relative activity into a bar-level matrix for liquid futures.
QPulse
Blends volume-normalized and volatility-adaptive RSI into a zero-centered momentum and intensity display.
Nexural Transform
Combines Fisher-style transformed momentum, CVD behavior, divergence, and labelled order-flow patterns.
Quant RSI
Uses Laguerre filtering, adaptive thresholds, volume context, and five-timeframe alignment to study momentum.
CVD Trendline
Weights an adaptive trendline and pressure cloud with cumulative-volume-delta behavior, filters, and divergence states.
Nexural JMA
Pairs a responsive Jurik-style average with ATR zones, strength shading, signals, and a multi-factor dashboard.
ACE Squeeze
Detects volatility compression and release while displaying bounded momentum, regime, cycle, and volume context.
QFA Volatility Meter
Scores fear, volatility, momentum peaks, divergence, support, volume behavior, wicks, and profile context for bottom studies.
VHull Adaptive
Uses adaptive Hull-style smoothing, zero-lag components, noise filtering, strength shading, and regime classification.
Nexural DI Pressure Imbalance
Combines DI direction, candle anatomy, volume weighting, imbalance, and cumulative-pressure approximation.
Owner-approved canonical map
Sage approved these naming and lifecycle relationships on 2026-08-23. This settles the catalog identity; it does not reveal protected Pine source or create performance evidence.
Current pressure-family engine and handbook identity. Nexural Imbalance Pro is the current protected TradingView presentation of this engine.
Aliases: Nexural Imbalance ProLong-running open-source publication identity that contains pressure-family history. Keep the title for source provenance; do not use it as proof that every historical release is the current DI Pressure Pro build.
A historical generation named in the Pressure Pro release history. It remains a supported handbook concept, but no separate current TradingView card was verified.
Aliases: Regime MatrixEarlier protected pressure implementation. It stays documented for members who still have access, but it is not the canonical current pressure build.
Aliases: DI Pressure ImbalanceCurrent public identity for the QFA Pro knowledge record. Supported as an experimental study tool; it must not be presented as a confirmed-bottom engine.
Aliases: QFA ProCurrent public identity for the VHull Elite knowledge record.
Aliases: VHull ElitePrivate/internal research record. It is not a current public TradingView release and carries no public member entitlement.
Current protected publication approved for the active indicator catalog.
Aliases: Delta TrendCurrent protected publication approved for the active indicator catalog.
Identity and version notes
The mapping is approved, while the original title drift remains visible for provenance and member troubleshooting.
- Nexural Imbalance Pro
Owner-approved mapping: DI Pressure Pro is the current engine and handbook identity; Nexural Imbalance Pro is its current protected TradingView presentation.
- Nexural Pressure Pro
Owner-approved mapping: Nexural Pressure Pro is the legacy public umbrella; DI Pressure Pro is the current pressure-family identity; Regime Matrix is a historical generation and supported handbook concept.
- QFA Volatility Meter
Owner-approved mapping: QFA Volatility Meter is the current public identity for QFA Pro and remains supported as an experimental study tool.
- VHull Adaptive
Owner-approved mapping: VHull Adaptive is the current public identity for the VHull Elite knowledge record.
- QVS Pro
Owner-approved classification: Private / internal. No current public TradingView release or member entitlement.
Protected-script truth sheet
Every public script has a complete documentation row. Where protected code, settings, or alert behavior cannot be inspected, the answer is “Not publicly verifiable”—not a guess.
Nexural MTF ProProtected · closed source · published current
- Pine version
- Not publicly verifiable from the protected/publication snapshot
- Release version
- Current public page snapshot as of 2026-08-24; semantic release number not supplied
- Default settings
- Use the installed script defaults; exact protected-source defaults are not publicly verifiable
- Markets
- Source-described chart use only; validate independently on the intended liquid market before relying on a read
- Sessions
- Use the session configured in the script and record it with every example; exact support matrix not supplied
- Timeframes
- Use only timeframes supported by the installed script and forward-tested for the intended decision; exact support matrix not supplied
- Closed bar / repaint
- Unverified from protected source. Use confirmed-bar alerts and treat intrabar values as provisional until code-level verification is recorded
- Alerts
- Not publicly verifiable from protected source; inspect the installed TradingView alert menu and preserve the selected condition
- Stack position
- Higher-timeframe structure and regime context
- Known limitation
- Developing higher-timeframe candles can change, its pressure layer is an OHLCV proxy rather than footprint delta, and its confirmed score is context—not a probability or trade signal.
Nexural Delta TrendProtected · closed source · published current
- Pine version
- Not publicly verifiable from the protected/publication snapshot
- Release version
- Current public page snapshot as of 2026-08-24; semantic release number not supplied
- Default settings
- Use the installed script defaults; exact protected-source defaults are not publicly verifiable
- Markets
- Source-described chart use only; validate independently on the intended liquid market before relying on a read
- Sessions
- Use the session configured in the script and record it with every example; exact support matrix not supplied
- Timeframes
- Use only timeframes supported by the installed script and forward-tested for the intended decision; exact support matrix not supplied
- Closed bar / repaint
- Public copy describes confirmed-bar use. Treat intrabar values as provisional; protected source behavior remains unverified.
- Alerts
- Not publicly verifiable from protected source; inspect the installed TradingView alert menu and preserve the selected condition
- Stack position
- Trend and participation context
- Known limitation
- Its delta is a lower-timeframe directional-volume estimate, not aggressor-side bid/ask footprint data, and the trend engine can still lag or whipsaw.
Nexural Volume ProfileProtected · closed source · published current
- Pine version
- Not publicly verifiable from the protected/publication snapshot
- Release version
- Current public page snapshot as of 2026-08-24; semantic release number not supplied
- Default settings
- Use the installed script defaults; exact protected-source defaults are not publicly verifiable
- Markets
- Source-described chart use only; validate independently on the intended liquid market before relying on a read
- Sessions
- Use the session configured in the script and record it with every example; exact support matrix not supplied
- Timeframes
- Use only timeframes supported by the installed script and forward-tested for the intended decision; exact support matrix not supplied
- Closed bar / repaint
- Unverified from protected source. Use confirmed-bar alerts and treat intrabar values as provisional until code-level verification is recorded
- Alerts
- Not publicly verifiable from protected source; inspect the installed TradingView alert menu and preserve the selected condition
- Stack position
- Location
- Known limitation
- Profile levels depend on the selected range, session, row resolution, and available volume data; no level is an automatic entry or guaranteed reaction.
Nexural Trend FinderProtected · closed source · published current
- Pine version
- Not publicly verifiable from the protected/publication snapshot
- Release version
- Current public page snapshot as of 2026-08-24; semantic release number not supplied
- Default settings
- Use the installed script defaults; exact protected-source defaults are not publicly verifiable
- Markets
- Source-described chart use only; validate independently on the intended liquid market before relying on a read
- Sessions
- Use the session configured in the script and record it with every example; exact support matrix not supplied
- Timeframes
- Use only timeframes supported by the installed script and forward-tested for the intended decision; exact support matrix not supplied
- Closed bar / repaint
- Unverified from protected source. Use confirmed-bar alerts and treat intrabar values as provisional until code-level verification is recorded
- Alerts
- Not publicly verifiable from protected source; inspect the installed TradingView alert menu and preserve the selected condition
- Stack position
- Trend context
- Known limitation
- The participation histogram is not true bid/ask delta, and showing every JMA turn does not make every cross a tradeable signal.
Nexural Imbalance ProProtected · closed source · published current
- Pine version
- Not publicly verifiable from the protected/publication snapshot
- Release version
- Current public page snapshot as of 2026-08-24; semantic release number not supplied
- Default settings
- Use the installed script defaults; exact protected-source defaults are not publicly verifiable
- Markets
- Source-described chart use only; validate independently on the intended liquid market before relying on a read
- Sessions
- Use the session configured in the script and record it with every example; exact support matrix not supplied
- Timeframes
- Use only timeframes supported by the installed script and forward-tested for the intended decision; exact support matrix not supplied
- Closed bar / repaint
- Unverified from protected source. Use confirmed-bar alerts and treat intrabar values as provisional until code-level verification is recorded
- Alerts
- Not publicly verifiable from protected source; inspect the installed TradingView alert menu and preserve the selected condition
- Stack position
- Participation and pressure context
- Known limitation
- Pressure is inferred from TradingView price and volume inputs; it is execution support, not a prediction engine or verified exchange-level order-flow feed.
Nexural Pressure ProOpen source · published current
- Pine version
- Not publicly verifiable from the protected/publication snapshot
- Release version
- Current public page snapshot as of 2026-08-24; page contains material historical title drift.
- Default settings
- Use the installed script defaults; exact protected-source defaults are not publicly verifiable
- Markets
- Source-described chart use only; validate independently on the intended liquid market before relying on a read
- Sessions
- Use the session configured in the script and record it with every example; exact support matrix not supplied
- Timeframes
- Use only timeframes supported by the installed script and forward-tested for the intended decision; exact support matrix not supplied
- Closed bar / repaint
- Unverified from protected source. Use confirmed-bar alerts and treat intrabar values as provisional until code-level verification is recorded
- Alerts
- Not publicly verifiable from protected source; inspect the installed TradingView alert menu and preserve the selected condition
- Stack position
- Participation and pressure context / Environment and regime
- Known limitation
- The current description is headed “DI Pressure Pro,” while visible release history also references Regime Matrix; do not assume the current code matches every historical handbook name.
Nexural Flow ProProtected · closed source · published current
- Pine version
- Not publicly verifiable from the protected/publication snapshot
- Release version
- Current public page snapshot as of 2026-08-24; semantic release number not supplied
- Default settings
- Use the installed script defaults; exact protected-source defaults are not publicly verifiable
- Markets
- Source-described chart use only; validate independently on the intended liquid market before relying on a read
- Sessions
- Use the session configured in the script and record it with every example; exact support matrix not supplied
- Timeframes
- Use only timeframes supported by the installed script and forward-tested for the intended decision; exact support matrix not supplied
- Closed bar / repaint
- Unverified from protected source. Use confirmed-bar alerts and treat intrabar values as provisional until code-level verification is recorded
- Alerts
- Not publicly verifiable from protected source; inspect the installed TradingView alert menu and preserve the selected condition
- Stack position
- Participation
- Known limitation
- TradingView does not provide full tape, DOM, or footprint data to Pine; the publication explicitly presents its flow as an approximation rather than true order flow.
Nexural QWAPProtected · closed source · published current
- Pine version
- Not publicly verifiable from the protected/publication snapshot
- Release version
- Current public page snapshot as of 2026-08-24; semantic release number not supplied
- Default settings
- Use the installed script defaults; exact protected-source defaults are not publicly verifiable
- Markets
- Source-described chart use only; validate independently on the intended liquid market before relying on a read
- Sessions
- Use the session configured in the script and record it with every example; exact support matrix not supplied
- Timeframes
- Use only timeframes supported by the installed script and forward-tested for the intended decision; exact support matrix not supplied
- Closed bar / repaint
- Unverified from protected source. Use confirmed-bar alerts and treat intrabar values as provisional until code-level verification is recorded
- Alerts
- Not publicly verifiable from protected source; inspect the installed TradingView alert menu and preserve the selected condition
- Stack position
- Location and session context
- Known limitation
- The public copy uses “true order flow” language but also states that TradingView lacks tick data; document the output as an intrabar proxy, not verified aggressor-side flow.
Nexural ORBProtected · closed source · published current
- Pine version
- Not publicly verifiable from the protected/publication snapshot
- Release version
- Current public page snapshot as of 2026-08-24; semantic release number not supplied
- Default settings
- Use the installed script defaults; exact protected-source defaults are not publicly verifiable
- Markets
- Source-described chart use only; validate independently on the intended liquid market before relying on a read
- Sessions
- Use the session configured in the script and record it with every example; exact support matrix not supplied
- Timeframes
- Use only timeframes supported by the installed script and forward-tested for the intended decision; exact support matrix not supplied
- Closed bar / repaint
- Unverified from protected source. Use confirmed-bar alerts and treat intrabar values as provisional until code-level verification is recorded
- Alerts
- Not publicly verifiable from protected source; inspect the installed TradingView alert menu and preserve the selected condition
- Stack position
- Location and opening-range structure
- Known limitation
- A quality score or aligned opening-range level does not establish direction, acceptable risk, or a valid breakout before the selected range has closed.
Nexural Fisher ProProtected · closed source · published current
- Pine version
- Not publicly verifiable from the protected/publication snapshot
- Release version
- Current public page snapshot as of 2026-08-24; semantic release number not supplied
- Default settings
- Use the installed script defaults; exact protected-source defaults are not publicly verifiable
- Markets
- Source-described chart use only; validate independently on the intended liquid market before relying on a read
- Sessions
- Use the session configured in the script and record it with every example; exact support matrix not supplied
- Timeframes
- Use only timeframes supported by the installed script and forward-tested for the intended decision; exact support matrix not supplied
- Closed bar / repaint
- Unverified from protected source. Use confirmed-bar alerts and treat intrabar values as provisional until code-level verification is recorded
- Alerts
- Not publicly verifiable from protected source; inspect the installed TradingView alert menu and preserve the selected condition
- Stack position
- Timing and momentum context
- Known limitation
- An extreme reading describes transformed price stretch; it does not require an immediate reversal and must be interpreted differently in trends and ranges.
Nexural OrderFlow MatrixProtected · closed source · published current
- Pine version
- Not publicly verifiable from the protected/publication snapshot
- Release version
- Current public page snapshot as of 2026-08-24; semantic release number not supplied
- Default settings
- Use the installed script defaults; exact protected-source defaults are not publicly verifiable
- Markets
- Source-described chart use only; validate independently on the intended liquid market before relying on a read
- Sessions
- Use the session configured in the script and record it with every example; exact support matrix not supplied
- Timeframes
- Use only timeframes supported by the installed script and forward-tested for the intended decision; exact support matrix not supplied
- Closed bar / repaint
- Unverified from protected source. Use confirmed-bar alerts and treat intrabar values as provisional until code-level verification is recorded
- Alerts
- Not publicly verifiable from protected source; inspect the installed TradingView alert menu and preserve the selected condition
- Stack position
- Participation context
- Known limitation
- The matrix relies on lower-timeframe TradingView volume functions, not raw tape or full depth; any correlation or edge claim needs independent evidence before publication.
QPulseProtected · closed source · published current
- Pine version
- Not publicly verifiable from the protected/publication snapshot
- Release version
- Current public page snapshot as of 2026-08-24; semantic release number not supplied
- Default settings
- Use the installed script defaults; exact protected-source defaults are not publicly verifiable
- Markets
- Source-described chart use only; validate independently on the intended liquid market before relying on a read
- Sessions
- Use the session configured in the script and record it with every example; exact support matrix not supplied
- Timeframes
- Use only timeframes supported by the installed script and forward-tested for the intended decision; exact support matrix not supplied
- Closed bar / repaint
- Unverified from protected source. Use confirmed-bar alerts and treat intrabar values as provisional until code-level verification is recorded
- Alerts
- Not publicly verifiable from protected source; inspect the installed TradingView alert menu and preserve the selected condition
- Stack position
- Timing
- Known limitation
- Volume normalization can reduce low-participation noise, but QPulse cannot create a valid location, define risk, or make a late move early again.
Nexural TransformProtected · closed source · published current
- Pine version
- Not publicly verifiable from the protected/publication snapshot
- Release version
- Current public page snapshot as of 2026-08-24; semantic release number not supplied
- Default settings
- Use the installed script defaults; exact protected-source defaults are not publicly verifiable
- Markets
- Source-described chart use only; validate independently on the intended liquid market before relying on a read
- Sessions
- Use the session configured in the script and record it with every example; exact support matrix not supplied
- Timeframes
- Use only timeframes supported by the installed script and forward-tested for the intended decision; exact support matrix not supplied
- Closed bar / repaint
- Unverified from protected source. Use confirmed-bar alerts and treat intrabar values as provisional until code-level verification is recorded
- Alerts
- Not publicly verifiable from protected source; inspect the installed TradingView alert menu and preserve the selected condition
- Stack position
- Momentum and participation context
- Known limitation
- Pattern labels such as iceberg, sweep, absorption, or smart money are inferences from available chart data, not direct proof of hidden orders or participant identity.
Quant RSIProtected · closed source · published current
- Pine version
- Not publicly verifiable from the protected/publication snapshot
- Release version
- Current public page snapshot as of 2026-08-24; semantic release number not supplied
- Default settings
- Use the installed script defaults; exact protected-source defaults are not publicly verifiable
- Markets
- Source-described chart use only; validate independently on the intended liquid market before relying on a read
- Sessions
- Use the session configured in the script and record it with every example; exact support matrix not supplied
- Timeframes
- Use only timeframes supported by the installed script and forward-tested for the intended decision; exact support matrix not supplied
- Closed bar / repaint
- Unverified from protected source. Use confirmed-bar alerts and treat intrabar values as provisional until code-level verification is recorded
- Alerts
- Not publicly verifiable from protected source; inspect the installed TradingView alert menu and preserve the selected condition
- Stack position
- Momentum context
- Known limitation
- Several timeframe readings can remain correlated, and public probability language is not validated performance evidence; structure and invalidation remain separate.
CVD TrendlineProtected · closed source · published current
- Pine version
- Not publicly verifiable from the protected/publication snapshot
- Release version
- Current public page snapshot as of 2026-08-24; semantic release number not supplied
- Default settings
- Use the installed script defaults; exact protected-source defaults are not publicly verifiable
- Markets
- Source-described chart use only; validate independently on the intended liquid market before relying on a read
- Sessions
- Use the session configured in the script and record it with every example; exact support matrix not supplied
- Timeframes
- Use only timeframes supported by the installed script and forward-tested for the intended decision; exact support matrix not supplied
- Closed bar / repaint
- Unverified from protected source. Use confirmed-bar alerts and treat intrabar values as provisional until code-level verification is recorded
- Alerts
- Not publicly verifiable from protected source; inspect the installed TradingView alert menu and preserve the selected condition
- Stack position
- Trend and participation context
- Known limitation
- CVD is estimated from intrabar or directional volume rather than verified aggressor-side prints, and divergence can persist without producing a timely reversal.
Nexural JMAProtected · closed source · published current
- Pine version
- Not publicly verifiable from the protected/publication snapshot
- Release version
- Current public page snapshot as of 2026-08-24; semantic release number not supplied
- Default settings
- Use the installed script defaults; exact protected-source defaults are not publicly verifiable
- Markets
- Source-described chart use only; validate independently on the intended liquid market before relying on a read
- Sessions
- Use the session configured in the script and record it with every example; exact support matrix not supplied
- Timeframes
- Use only timeframes supported by the installed script and forward-tested for the intended decision; exact support matrix not supplied
- Closed bar / repaint
- Unverified from protected source. Use confirmed-bar alerts and treat intrabar values as provisional until code-level verification is recorded
- Alerts
- Not publicly verifiable from protected source; inspect the installed TradingView alert menu and preserve the selected condition
- Stack position
- Trend context
- Known limitation
- A responsive average still lags price, and the dashboard score combines related technical inputs rather than independent proof or calibrated win probability.
ACE SqueezeProtected · closed source · published current
- Pine version
- Not publicly verifiable from the protected/publication snapshot
- Release version
- Current public page snapshot as of 2026-08-24; semantic release number not supplied
- Default settings
- Use the installed script defaults; exact protected-source defaults are not publicly verifiable
- Markets
- Source-described chart use only; validate independently on the intended liquid market before relying on a read
- Sessions
- Use the session configured in the script and record it with every example; exact support matrix not supplied
- Timeframes
- Use only timeframes supported by the installed script and forward-tested for the intended decision; exact support matrix not supplied
- Closed bar / repaint
- Unverified from protected source. Use confirmed-bar alerts and treat intrabar values as provisional until code-level verification is recorded
- Alerts
- Not publicly verifiable from protected source; inspect the installed TradingView alert menu and preserve the selected condition
- Stack position
- Environment and volatility
- Known limitation
- Compression prepares a scenario but does not choose breakout direction, timing, stop location, or position size; false releases still occur.
QFA Volatility MeterProtected · closed source · published current experimental
- Pine version
- Not publicly verifiable from the protected/publication snapshot
- Release version
- Current public page snapshot as of 2026-08-24; semantic release number not supplied
- Default settings
- Use the installed script defaults; exact protected-source defaults are not publicly verifiable
- Markets
- Source-described chart use only; validate independently on the intended liquid market before relying on a read
- Sessions
- Use the session configured in the script and record it with every example; exact support matrix not supplied
- Timeframes
- Use only timeframes supported by the installed script and forward-tested for the intended decision; exact support matrix not supplied
- Closed bar / repaint
- Unverified from protected source. Use confirmed-bar alerts and treat intrabar values as provisional until code-level verification is recorded
- Alerts
- Not publicly verifiable from protected source; inspect the installed TradingView alert menu and preserve the selected condition
- Stack position
- Experimental volatility and reversal study
- Known limitation
- The publication calls the indicator experimental and documents a fundamental lag problem; a score cannot confirm a bottom or substitute for forward validation.
VHull AdaptiveProtected · closed source · published current
- Pine version
- Not publicly verifiable from the protected/publication snapshot
- Release version
- Current public page snapshot as of 2026-08-24; semantic release number not supplied
- Default settings
- Use the installed script defaults; exact protected-source defaults are not publicly verifiable
- Markets
- Source-described chart use only; validate independently on the intended liquid market before relying on a read
- Sessions
- Use the session configured in the script and record it with every example; exact support matrix not supplied
- Timeframes
- Use only timeframes supported by the installed script and forward-tested for the intended decision; exact support matrix not supplied
- Closed bar / repaint
- Unverified from protected source. Use confirmed-bar alerts and treat intrabar values as provisional until code-level verification is recorded
- Alerts
- Not publicly verifiable from protected source; inspect the installed TradingView alert menu and preserve the selected condition
- Stack position
- Trend context
- Known limitation
- Adaptive smoothing cannot eliminate lag or prevent whipsaw, and a bright trend state does not repair poor location or reward-to-risk.
Nexural DI Pressure ImbalanceProtected · closed source · published current
- Pine version
- Not publicly verifiable from the protected/publication snapshot
- Release version
- Current public page snapshot as of 2026-08-24; semantic release number not supplied
- Default settings
- Use the installed script defaults; exact protected-source defaults are not publicly verifiable
- Markets
- Source-described chart use only; validate independently on the intended liquid market before relying on a read
- Sessions
- Use the session configured in the script and record it with every example; exact support matrix not supplied
- Timeframes
- Use only timeframes supported by the installed script and forward-tested for the intended decision; exact support matrix not supplied
- Closed bar / repaint
- Unverified from protected source. Use confirmed-bar alerts and treat intrabar values as provisional until code-level verification is recorded
- Alerts
- Not publicly verifiable from protected source; inspect the installed TradingView alert menu and preserve the selected condition
- Stack position
- Participation and pressure context
- Known limitation
- The order-flow component is inferred from candle and volume behavior, not verified bid/ask execution data, and the display is supporting evidence rather than a complete setup.
Indicator reference
Open any record to see the question it answers, the evidence it reads, and the conclusion it cannot make for you.
01 core · location · Where?Nexural Volume Profile
Maps auction location and acceptance across price.
- Reads
- POC, VAH, VAL, HVNs, LVNs, value migration, rejection, and prior-session structure.
- Use
- Use first to define locations worth observing.
- Best when
- You need an auction map before price reaches a level worth observing.
- Pairs with
- Pair with QPulse for timing and Flow Pro for participation after the location is defined.
- Failure
- Treating every POC, VAH, VAL, HVN, or LVN as automatic support, resistance, or a guaranteed revisit.
- Boundary
- It does not provide direction or an entry by itself.
How to use it
Volume Profile is your auction map. It shows where the market accepted price, where it moved quickly, and which prior locations may matter again.
What you see
- POC marks the price with the most recorded volume in the selected profile.
- VAH and VAL bound the area containing roughly 70% of the profile volume.
- HVNs show accepted, high-volume areas; LVNs show thin areas price may cross quickly.
- Value overlap and POC migration show whether value is balancing or moving between sessions.
What drives it
- The documented build distributes lower-timeframe volume across price rows and smooths node classification.
- Its layers add delta, clustered supply and demand zones, prior-session context, and market-condition tags.
- The profile can label D, P, b, and B shapes, but the shape describes distribution rather than future direction.
Four-step workflow
- 1
Select the session and profile range that match the decision you are studying.
- 2
Mark POC, VAH, VAL, important HVNs and LVNs, and any fresh zone before price arrives.
- 3
Classify value as inside, overlapping, or separate from the prior session.
- 4
Wait for timing and participation evidence at the marked location before planning risk.
Price returns to VAL after spending the morning inside the prior value area.
- Read
- VAL is a location worth observing. The overlapping value areas suggest balance, but they do not prove that VAL will hold.
- Decision
- Mark the level, wait for QPulse timing and Flow Pro participation, then pass if price accepts below VAL or the risk geometry fails.
Professional note and common misreads
Professional note
Profile output depends on session boundaries, row size, data resolution, and the volume source. Compare settings and data feeds before treating two profiles as equivalent.
Common misreads
- Buying every VAL touch or shorting every VAH touch.
- Calling a naked POC a guaranteed magnet with a guaranteed arrival time.
- Changing the profile range until it supports the trade you already want.
Practice it: Before the next session, mark one balanced profile and one migrating profile. Write what would confirm acceptance and what would prove rejection at each boundary.
02 core · momentum · When?QPulse
Times execution with a volume-normalized momentum and volatility heat map.
- Reads
- Direction, intensity, zero-line transitions, volatility compression, and extension zones.
- Use
- Use only after price reaches a planned location.
- Best when
- Price has reached a planned location and you need one observable execution condition.
- Pairs with
- Pair with Volume Profile location and Flow Pro participation inside the documented STS sequence.
- Failure
- Chasing a cross after price has left the location or using an extended reading as a fresh entry.
- Boundary
- It does not make a poor location valid or justify chasing an extended move.
How to use it
QPulse is the clock in the STS sequence. It shows direction, intensity, and volatility behavior after price reaches a location you already planned.
What you see
- Green and red heat-map bars show the direction and relative intensity of the current impulse.
- Zero-line transitions show momentum changing sides; brightness shows intensity, not certainty.
- Adaptive bands and compression states show whether volatility is coiling, expanding, or already extended.
What drives it
- The documented engine blends volume-weighted RSI with ATR-adaptive RSI and dampens weak-volume readings.
- Seven detection layers cover delta, volatility signatures, VWAP deviation, relative volume, divergence, intermarket volatility, and a CVD proxy.
- Volatility-of-volatility and regime weighting change how the oscillator responds as conditions change.
Four-step workflow
- 1
Confirm that price is at a valid Volume Profile or structural location.
- 2
Identify whether QPulse is early, valid, late, extended, or missing.
- 3
Observe the first one to three response candles instead of chasing candle four.
- 4
Send the candidate to Flow Pro and the risk gate before considering execution.
Price tests a planned demand zone while QPulse is deeply negative and begins moving toward zero.
- Read
- Selling momentum may be exhausting, but the approach to zero is only a developing timing condition.
- Decision
- Wait for the documented transition and prompt price response, then check Flow Pro. If the response arrives late or flow stays dead, pass.
Professional note and common misreads
Professional note
QPulse combines several transformed inputs, so its components are not independent votes. Validate latency, threshold stability, and regime behavior by market and timeframe.
Common misreads
- Scanning QPulse first and inventing a location after the trigger appears.
- Treating brighter color as permission to increase size.
- Entering after the move is extended because the histogram still looks strong.
Practice it: Replay ten QPulse transitions at pre-marked levels. Label each early, valid, late, or missing before you reveal what price did next.
03 core · participation · Go or no-go?Nexural Flow Pro
Checks participation and filters low-quality, balanced flow.
- Reads
- Buy/sell dominance, imbalance ratios, session delta, activity, and low-volume chop.
- Use
- Use after location and trigger as the participation check.
- Best when
- A valid location and timing trigger already exist and you need a final go-or-no-go participation check.
- Pairs with
- Pair after Volume Profile and QPulse; it confirms or rejects rather than leading the sequence.
- Failure
- Forcing a trade during flat, balanced, or low-activity flow because the other indicators look attractive.
- Boundary
- It cannot rescue a missing trigger or conflicting higher-timeframe structure.
How to use it
Flow Pro asks whether meaningful participation supports the planned move. In STS it is the final market-evidence filter before the independent risk check.
What you see
- Buy and sell columns show which side is active and whether one side dominates.
- A 3:1 or greater imbalance receives the documented extreme-imbalance treatment.
- Session delta and volume status distinguish active flow from flat, balanced, or thin conditions.
What drives it
- The indicator prioritizes available up/down volume data and uses a synthetic estimate when that data is unavailable.
- Documented activity labels treat volume above 1.5 times average as high and below 0.5 times average as low.
- The visual glow highlights ratio dominance; it does not establish location, structure, or acceptable risk.
Four-step workflow
- 1
Confirm that location and timing have already passed their gates.
- 2
Compare buy and sell dominance with the intended direction.
- 3
Reject opposing, dead, low-volume, or balanced participation.
- 4
Approve only the evidence layer, then calculate the trade plan separately.
Volume Profile location and QPulse timing align for a long, but Flow Pro remains flat with balanced columns.
- Read
- The first two gates passed, but participation is missing. The setup is incomplete.
- Decision
- Pass. More size, a tighter stop, or a brighter QPulse bar cannot repair dead flow.
Professional note and common misreads
Professional note
Always identify whether the platform supplied real up/down volume or a fallback estimate. Data provenance changes how strongly you can interpret delta and imbalance.
Common misreads
- Using Flow Pro as a standalone entry signal in the middle of nowhere.
- Assuming a glowing imbalance guarantees continuation.
- Ignoring the difference between real volume data and fallback estimation.
Practice it: Capture five aligned-flow examples and five dead-flow examples at planned levels. Write the pass decision before checking the outcome.
04 supporting · trend · Is trend participation building?Nexural Trend Finder
Combines dual JMA trend state with an early participation histogram.
- Reads
- Trend flips, activity, body efficiency, close bias, volatility bands, and trend score.
- Use
- Use for trend context and early participation changes.
- Best when
- You need responsive trend state plus an early view of whether participation is strengthening or fading.
- Pairs with
- Pair with a location framework and a separate risk plan; use it to support trend context, not replace it.
- Failure
- Reading a trend flip as a precise entry or assuming the participation histogram predicts the next candle.
- Boundary
- It is not a standalone prediction of the next price move.
How to use it
Trend Finder gives you a responsive trend state and an early read on whether participation is building before the moving averages fully turn.
What you see
- Fast and slow JMA lines show the documented trend relationship and flip state.
- The participation histogram combines delta, activity, candle-body efficiency, and close position.
- ATR bands expand and contract with volatility; the dashboard summarizes regime, activity, volatility, and signal state.
What drives it
- The documented defaults use fast JMA 7 and slow JMA 9 rather than standard exponential averages.
- Participation is a composite score, so its inputs should not be counted again as separate confirmation.
- Histogram breaks outside adaptive ATR bands flag unusual intensity relative to current volatility.
Four-step workflow
- 1
Classify the higher-timeframe structure before reading the trend state.
- 2
Compare the JMA relationship with the participation histogram.
- 3
Check whether activity and volatility support continuation or warn of noise.
- 4
Use a separate location, trigger, and risk rule for any executable plan.
The fast JMA turns above the slow JMA while participation strengthens, but price is already far above the nearest planned level.
- Read
- Trend participation is improving. The location and reward-to-risk are still poor.
- Decision
- Record bullish context and wait for a structured pullback instead of chasing the flip.
Professional note and common misreads
Professional note
“Zero lag” is a design goal, not literal foresight. Measure crossover delay, whipsaw frequency, and participation-score stability in trend, transition, and chop.
Common misreads
- Entering every JMA cross.
- Calling the participation histogram predictive.
- Ignoring location because the trend score is high.
Practice it: Review twenty flips and separate them by regime. Compare how many held in trends versus how many whipsawed in balance.
05 supporting · regime · What is the higher-timeframe auction doing?Nexural MTF Pro
Places up to three higher-timeframe candles, structure, phase, session rails, and confirmed decision context on the execution chart.
- Reads
- Live and confirmed HTF candles, pivots, BOS, CHoCH, market phase, session levels, auction location, pressure proxy, and decision score.
- Use
- Use before execution to keep higher-timeframe context visible while evaluating a planned lower-timeframe setup.
- Best when
- You execute on a lower timeframe and need higher-timeframe structure, phase, auction location, and session context without changing charts.
- Pairs with
- Pair with a planned location, one execution trigger, and an independent risk plan; let the higher-timeframe read filter rather than manufacture trades.
- Failure
- Treating a developing candle as confirmed, reading the score as win probability, or calling its OHLCV pressure proxy true bid/ask delta.
- Boundary
- The score is not a probability, the proxy is not footprint delta, and developing higher-timeframe candles are not locked evidence.
How to use it
MTF Pro keeps the larger auction in view while you work from an execution chart. It can show up to three higher timeframes, their structure and phase, session rails, and a compact confirmed-state summary without asking you to keep switching charts.
What you see
- Mini charts show live higher-timeframe candles beside confirmed candles; live values may continue changing until that higher-timeframe bar closes.
- Structure labels distinguish confirmed pivots, breaks of structure, changes of character, and an EMA fallback when confirmed pivots are not yet available.
- The dashboard summarizes market phase, auction location, session context, an OHLCV pressure proxy, and the confirmed decision state for the selected timeframes.
- Session rails can map prior-day and overnight reference levels using futures-oriented presets or a documented custom session.
What drives it
- The public description separates developing higher-timeframe information from confirmed closed-candle state so the user can see what is provisional.
- Its confirmed decision state requires agreement from at least 80% of the factors that are available; that threshold is a rules-based context label, not measured trade probability.
- The pressure component infers directional participation from OHLCV behavior. It is explicitly a proxy because Pine does not expose exchange footprint or full bid/ask aggressor data.
Four-step workflow
- 1
Use standard candles and select ascending higher timeframes that match the holding horizon you actually trade.
- 2
Choose the correct futures-session preset—or document the custom session—and verify feed delay, symbol mapping, and contract-roll behavior.
- 3
Separate LIVE from CONFIRMED state, then compare confirmed structure, phase, auction location, and session rails with the setup you planned.
- 4
Use alignment or conflict as context only; require a separate execution trigger, invalidation, position size, and maximum loss before acting.
A 3-minute NQ setup points long while the selected 15-, 60-, and 240-minute panels are broadly bullish, but price is pressing into prior-day high near the edge of the daily range.
- Read
- Higher-timeframe direction agrees, yet auction location and a major session rail reduce the quality of a late continuation. Alignment describes context; it does not erase location risk.
- Decision
- Wait for acceptance above the rail and a fresh lower-timeframe trigger, or pass if the stop and target no longer produce acceptable risk. Do not enter merely because the confirmed score is high.
Professional note and common misreads
Professional note
Developing HTF bars can change, confirmed pivots arrive with delay, synthetic chart types can distort inputs, and continuous futures can differ around rolls or across data feeds. Validate session boundaries and symbol history before comparing results.
Common misreads
- Treating a LIVE higher-timeframe candle as if it were closed and permanent.
- Reading the confirmed score as an 80% win rate or automatic order signal.
- Calling the OHLCV pressure proxy true order flow, footprint delta, or participant identity.
- Using the wrong session preset or synthetic candles and assuming the rails and structure remain comparable.
Practice it: Replay twenty lower-timeframe decisions with fixed HTFs and session settings. Before revealing the outcome, record live versus confirmed state, structure, phase, nearest rail, proxy agreement, invalidation, and whether the correct action was enter, wait, or pass.
06 supporting · trend · Does estimated volume support the trend turn?Nexural Delta Trend
Combines an adaptive trend engine with lower-timeframe volume-delta confirmation.
- Reads
- Trend flips, adaptive bands, buy/sell volume estimates, delta agreement, activity, and signal tiers.
- Use
- Use after structure and location to grade whether participation supports a trend signal.
- Best when
- You need one overlay to compare a trend turn with lower-timeframe directional-volume participation.
- Pairs with
- Pair with Volume Profile or another location framework, then calculate risk independently from the signal tier.
- Failure
- Calling the delta estimate true footprint data or entering every confirmed flip without location and risk geometry.
- Boundary
- Its delta is not true bid/ask footprint data, and a confirmed flip is not a complete trade plan.
How to use it
Delta Trend keeps direction and participation on one chart. The trend engine shows the active path; the delta layer asks whether estimated buying or selling volume supports each turn.
What you see
- The Staircase engine steps only after price travels an ATR-aware distance, while the optional adaptive engine uses a faster cycle-sensitive relationship.
- Signal tiers distinguish an ordinary trend flip from a flip that receives stronger participation confirmation.
- The panel compares current direction, estimated delta, bias agreement, activity, and confirmation state.
What drives it
- The public description offers Staircase and adaptive MAMA/FAMA-style trend modes with controls for sensitivity and closed-bar confirmation.
- Delta is estimated by classifying lower-timeframe bars as buying or selling and summing their volume inside the chart bar.
- Adaptive bands widen in noisier conditions and tighten during cleaner directional movement to reduce unnecessary state changes.
Four-step workflow
- 1
Choose one trend mode and settings for a defined market, timeframe, and session.
- 2
Wait for a closed-bar flip or continuation state at a location you planned before the signal appeared.
- 3
Compare the signal direction with the delta-confirmation panel and treat disagreement as a warning, not an automatic reversal.
- 4
Define the stop, target, invalidation, and size outside the indicator before deciding whether the setup is executable.
Delta Trend flips bullish at a pre-marked demand level, but the panel reports bearish delta and weak activity on the closing bar.
- Read
- Direction changed, but the participation estimate did not confirm the turn. The evidence stack is incomplete rather than automatically bearish.
- Decision
- Wait for price acceptance and improving participation or pass. Do not increase size to compensate for a low-quality confirmation state.
Professional note and common misreads
Professional note
Lower-timeframe candle direction is a volume-delta proxy, not aggressor-side trade classification. Test signal delay, band adaptation, proxy error, and whipsaw by instrument and session.
Common misreads
- Calling estimated delta a footprint or tape reading.
- Entering every trend flip without location.
- Treating delta disagreement as a guaranteed reversal.
Practice it: Replay thirty closed-bar flips. Record location, mode, delta agreement, activity, and the next structural outcome without changing labels afterward.
07 supporting · participation · Which side is applying pressure?Nexural Pressure Pro
Synthesizes directional pressure, delta, effort-versus-result, and regime.
- Reads
- DI imbalance, delta, absorption, continuation, higher-timeframe bias, and confidence.
- Use
- Use to test whether pressure agrees with the setup.
- Best when
- You need to compare directional pressure, effort, result, and higher-timeframe agreement around a setup.
- Pairs with
- Pair with Volume Profile or QWAP location and one timing tool to test whether pressure supports the thesis.
- Failure
- Treating a composite confidence score as certainty or ignoring absorption and conflicting structure.
- Boundary
- A confidence score does not guarantee continuation or remove the need for risk controls.
How to use it
Pressure Pro asks which side is applying effective pressure and whether that effort is producing real price movement.
What you see
- DI+ and DI− show directional pressure while delta and imbalance show participation.
- Absorption and continuation scores compare effort with price result.
- The dashboard reports state, higher-timeframe bias, confidence, and regime context.
What drives it
- The documented impulse test includes volume above 1.5 times average, delta above 55%, and imbalance above 2.5:1.
- A hysteresis engine uses separate enter and exit bands—documented defaults 22 and 12—to reduce flip-flop.
- The engine can use real delta when available and synthetic candle-based estimates when it is not.
Four-step workflow
- 1
Start with higher-timeframe structure and a meaningful location.
- 2
Compare pressure direction with effort-versus-result behavior.
- 3
Check the higher-timeframe gate and confidence without treating either as certainty.
- 4
Reject conflict or absorption that contradicts the intended continuation.
Bullish DI and positive delta appear at resistance, but high effort produces little upward progress.
- Read
- The directional inputs look bullish while effort-versus-result warns of absorption.
- Decision
- Do not promote the confidence score above the contradictory absorption evidence. Wait for acceptance or pass.
Professional note and common misreads
Professional note
Confidence is a model score built from related inputs, not a calibrated probability of profit. Test its conditional outcomes and document whether real or synthetic delta fed the read.
Common misreads
- Reading confidence as win probability.
- Ignoring absorption when direction is attractive.
- Mixing synthetic and real delta results in one test set.
Practice it: Collect ten continuation labels and ten absorption labels. Record the next structural outcome without changing the label after the fact.
08 supporting · regime · What environment are we in?Nexural Regime Matrix
Classifies trend and flow into a visual market-regime matrix.
- Reads
- Markup, markdown, accumulation, distribution, range, confluence, and regime velocity.
- Use
- Use before selecting a strategy or interpreting a trigger.
- Best when
- You must choose whether trend, range, accumulation, distribution, or transition logic fits the environment.
- Pairs with
- Pair before the setup tools so the active regime decides which locations and triggers deserve attention.
- Failure
- Changing strategy from every matrix update or using a regime label as an entry without price-level evidence.
- Boundary
- It does not turn an unfavorable environment into a tradable setup.
How to use it
Regime Matrix helps you choose the right kind of strategy before you hunt for an entry. It maps trend and flow into a visible market state.
What you see
- The 11-by-11 matrix places trend on one axis and delta or flow on the other.
- Quadrants describe markup, markdown, accumulation, and distribution.
- State, confluence, velocity, and destination show both the current label and how it is changing.
What drives it
- The trend engine can use documented Ehlers, ZLEMA, or Kalman-style methods.
- A 0–100 confluence score blends trend strength, delta, volume, and momentum alignment.
- ADX separates ranging conditions from directional ones; velocity labels range from stall to surge.
Four-step workflow
- 1
Read the current regime before selecting a playbook.
- 2
Observe whether the state is stable, accelerating, slowing, or transitioning.
- 3
Choose trend, range, or no-trade logic that fits that environment.
- 4
Require separate location and execution evidence before acting.
The matrix moves from ranging toward markup while price remains below a planned breakout level.
- Read
- The environment is improving for a trend play, but price has not completed the structural trigger.
- Decision
- Prepare the trend scenario and wait. A destination arrow is context, not an entry.
Professional note and common misreads
Professional note
Regime labels are path-dependent classifications. Evaluate transition lag, dwell time, and false state changes rather than measuring only end-of-sample accuracy.
Common misreads
- Trading every dot movement.
- Calling accumulation a confirmed bottom.
- Using a regime label without a location or invalidation.
Practice it: Replay three session types and record the regime at fixed intervals. Note when the label helped and when transition lag mattered.
09 supporting · location · How is price behaving around VWAP?Nexural QWAP
Adds CVD, volatility-adaptive bands, and session context to VWAP.
- Reads
- VWAP deviation, absorption, sweeps, CVD divergence, imbalances, and session weighting.
- Use
- Use for institutional mean and deviation context.
- Best when
- You need session-weighted value, deviation bands, and CVD context around the institutional mean.
- Pairs with
- Pair with regime context, one timing trigger, and participation evidence at a VWAP or band interaction.
- Failure
- Assuming every VWAP or band touch must reverse, hold, or produce a tradeable mean reversion.
- Boundary
- A VWAP touch is not an automatic entry or reversal signal.
How to use it
QWAP adds order-flow and volatility context to VWAP so you can judge whether price is accepting, stretching, sweeping, or absorbing around session value.
What you see
- VWAP and sigma bands show session value and standardized distance from it.
- CVD, divergence, absorption, sweep, and stacked-imbalance states add participation context.
- The dashboard shows bias, setup quality, activity heat, and volatility regime.
What drives it
- The documented design uses intrabar CVD, volatility-adaptive bands, and five detection systems.
- Session weighting gives the open and power hour more influence than lunch conditions.
- Adaptive weighting changes the role of CVD as the market regime changes.
Four-step workflow
- 1
Anchor the VWAP session correctly for the market you trade.
- 2
Measure price location and sigma distance before interpreting a touch.
- 3
Check CVD and detection states for acceptance, absorption, or sweep evidence.
- 4
Combine the read with regime, structure, and independent risk limits.
Price tests the lower adaptive band during a calm session while CVD diverges upward.
- Read
- The deviation and divergence support a mean-reversion hypothesis, but the band touch alone is insufficient.
- Decision
- Wait for price acceptance and a defined trigger; reject the trade if the regime is strongly directional against it.
Professional note and common misreads
Professional note
VWAP output changes with session anchor, feed, and intrabar resolution. Compare like-for-like settings and treat setup quality as a model score rather than a probability.
Common misreads
- Buying every lower-band touch.
- Assuming CVD divergence must resolve immediately.
- Comparing VWAPs with different session anchors.
Practice it: Mark ten VWAP band touches and classify acceptance, rejection, or continuation before reviewing the next thirty minutes.
10 supporting · location · Where is the opening auction resolving?Nexural ORB
Tracks multiple opening ranges, quality, confluence, breaks, and reclaims.
- Reads
- 5-, 15-, 30-, and 60-minute ranges, overnight levels, volume, and extensions.
- Use
- Use once the selected opening range has fully formed.
- Best when
- The chosen opening range has fully formed and you need a consistent map for breaks, reclaims, and extensions.
- Pairs with
- Pair with Regime Matrix or QVS for environment and a separate trigger/pressure tool after the range forms.
- Failure
- Anticipating the breakout before the range is complete or trading every break without acceptance evidence.
- Boundary
- It does not justify anticipating a breakout before the range is complete.
How to use it
ORB maps the opening auction. It tells you where the early range formed, how clean it is, and whether a later break or reclaim deserves attention.
What you see
- Five-, 15-, 30-, and 60-minute opening ranges can be displayed together.
- Grades summarize range tightness, volume, weekday, and overnight context.
- Break, reclaim, overnight levels, and one-times or 1.5-times extensions define scenarios and targets.
What drives it
- The range does not exist until its selected time window closes.
- Confluence checks alignment among several ORB boundaries, overnight levels, and the session open.
- Volume and time filters reduce low-quality break labels but cannot remove false breaks.
Four-step workflow
- 1
Choose the ORB window before the session opens.
- 2
Wait until that range is complete before treating its boundaries as fixed.
- 3
Compare a break or reclaim with volume, regime, and overnight context.
- 4
Plan invalidation inside or beyond the range according to the tested playbook.
A tight 15-minute range completes near the overnight high, then price breaks above on rising volume.
- Read
- The range quality and confluence support a breakout scenario, but the close and acceptance above the boundary still matter.
- Decision
- Use the planned trigger and stop. If price immediately reclaims the range from above to below, treat it as a failed break rather than defend the story.
Professional note and common misreads
Professional note
ORB behavior is highly instrument-, session-, and event-dependent. Validate the chosen window and extension logic instead of assuming the highest grade transfers across markets.
Common misreads
- Entering before the range forms.
- Assuming an A grade guarantees a trend day.
- Ignoring a fast reclaim back inside the range.
Practice it: Track one ORB window for twenty sessions. Record range width, grade, break direction, reclaim, and maximum extension.
11 supporting · momentum · Is price statistically stretched?Nexural Fisher Pro
Applies an adaptive, volume-weighted Fisher Transform with regime awareness.
- Reads
- Bounded extremes, adaptive cycles, smoothed turns, volume, and trend/range state.
- Use
- Use to interpret stretch differently in trends and ranges.
- Best when
- You need a regime-aware view of statistical stretch and turning behavior after location is already known.
- Pairs with
- Pair with Volume Profile or QWAP so an extreme is interpreted at a meaningful auction location.
- Failure
- Shorting because the oscillator is high or buying because it is low while a strong trend persists.
- Boundary
- Overbought does not mean price must fall, and oversold does not mean it must rise.
How to use it
Fisher Pro shows statistical stretch and turning behavior. Its meaning changes between a range and a trend, so the regime comes first.
What you see
- A bounded Fisher line moves within approximately minus three to plus three.
- Crosses and turns show momentum transitions while adaptive periods respond to the dominant cycle.
- Volume weighting and regime labels help separate range reversals from trend continuation.
What drives it
- Tanh normalization bounds extreme output instead of allowing scale blowouts.
- The documented engine uses an adaptive period and a two-pole Ehlers-style smoother.
- Efficiency ratio changes how overbought and oversold states are interpreted.
Four-step workflow
- 1
Classify the market as trending or ranging.
- 2
Locate the Fisher reading relative to its stretch zones.
- 3
Wait for the appropriate cross or continuation behavior at a meaningful price level.
- 4
Confirm with independent structure and participation before defining risk.
Fisher turns upward from an oversold area while price is in a strong bearish trend and below value.
- Read
- The oscillator is stretched, but trend conditions make a simple mean-reversion interpretation weak.
- Decision
- Do not buy the extreme alone. Require structural reversal and participation or treat the turn as a pause inside the downtrend.
Professional note and common misreads
Professional note
Adaptive oscillators can look cleaner in hindsight because the estimated cycle changes. Test real-time state transitions and parameter stability without using revised future context.
Common misreads
- Equating oversold with buy.
- Ignoring regime.
- Counting Fisher and another similar oscillator as independent evidence.
Practice it: Separate twenty Fisher turns into trend and range samples. Compare reversal and continuation outcomes without moving the thresholds.
12 supporting · order flow · What happened inside this bar?Nexural OrderFlow Matrix
Displays per-bar order-flow activity in a compact heat-map matrix.
- Reads
- Volume, delta, delta percentage, buy/sell volume, bar VWAP, CVD, and activity.
- Use
- Use for detailed participation evidence at a planned location.
- Best when
- You need compact bar-level evidence about volume, delta, CVD, VWAP, and relative activity at a planned level.
- Pairs with
- Pair with higher-timeframe structure and a location tool; use the matrix to inspect participation detail.
- Failure
- Reacting to one bright cell without checking surrounding structure, persistence, and data quality.
- Boundary
- A single bright cell is not enough evidence for a trade.
How to use it
OrderFlow Matrix compresses each candle’s volume and delta behavior into a heat-map row so you can inspect participation without opening several panels.
What you see
- Each bar can display volume, buy volume, sell volume, delta, delta percentage, bar VWAP, and CVD.
- Stacked imbalance bars show which side dominated inside the candle.
- Heat intensity compares activity with the selected threshold; quiet bars fade toward gray.
What drives it
- The documented build uses available up/down volume data for per-bar classification.
- Activity thresholds deliberately suppress visually loud conclusions from low-volume bars.
- The matrix aggregates bar evidence; it does not show every price-level transaction inside a footprint.
Four-step workflow
- 1
Mark the location and higher-timeframe thesis first.
- 2
Inspect several adjacent matrix rows rather than one isolated cell.
- 3
Compare delta, activity, and price result for persistence or absorption.
- 4
Use the read as confirmation and define the trade outside the matrix.
One bright positive-delta cell appears at resistance, surrounded by low-activity mixed rows.
- Read
- The isolated cell shows activity, not persistent acceptance or a complete shift in participation.
- Decision
- Wait for repeated evidence and price result. One bright square does not earn a trade.
Professional note and common misreads
Professional note
Aggregation hides sequence within the bar. When execution depends on microstructure, verify the feed and compare the matrix with tick-level footprint or tape evidence.
Common misreads
- Trading the brightest cell.
- Ignoring adjacent bars.
- Treating bar aggregation as a full footprint.
Practice it: Select ten planned levels and describe three-bar flow before looking at the next candle. Track whether persistence mattered.
13 supporting · order flow · Do trend direction and cumulative pressure agree?CVD Trendline
Weights an adaptive trendline and pressure cloud with cumulative-volume-delta behavior.
- Reads
- Trend direction, pressure intensity, filter state, Laguerre momentum, CVD agreement, and divergence.
- Use
- Use after structure and location to inspect whether estimated pressure supports the active trend.
- Best when
- You need a trend reference that makes agreement or conflict with estimated cumulative pressure visible.
- Pairs with
- Pair with higher-timeframe structure and a planned level; use divergence to investigate, not to predict a turn.
- Failure
- Treating estimated CVD as participant identity or assuming every divergence must resolve with an immediate reversal.
- Boundary
- CVD divergence does not guarantee reversal, and the volume split is not verified aggressor-side flow.
How to use it
CVD Trendline blends a price trendline with cumulative-volume-delta behavior. It helps you see when price direction and estimated pressure agree, weaken, or diverge.
What you see
- The central adaptive line shows trend direction while the surrounding cloud changes with estimated pressure intensity.
- Standard, Kalman-style, and Butterworth-style filter modes trade responsiveness against smoothness in different ways.
- Divergence, pressure, Laguerre, and dashboard states expose agreement or conflict between price and the CVD estimate.
What drives it
- The public description integrates intrabar CVD behavior into selectable signal-processing filters and a pressure-sensitive cloud.
- When lower-timeframe detail is available, the script uses it to improve the volume split; less granular history can reduce that detail.
- Laguerre momentum and divergence logic add context, but they remain transformations of price and volume rather than independent participant data.
Four-step workflow
- 1
Select one filter mode and document why it fits the market and horizon you are studying.
- 2
Read trend direction and cloud intensity only after higher-timeframe structure and location are clear.
- 3
Use price/CVD agreement as supporting participation evidence and use divergence as a reason to investigate or reduce confidence.
- 4
Require an observable trigger and independent risk plan before execution.
Price presses into prior resistance while the trendline stays bullish, but the cloud fades and bearish CVD divergence appears.
- Read
- Price direction remains up while estimated pressure no longer confirms with the same intensity. That is conflict, not proof of an immediate short.
- Decision
- Avoid initiating a late continuation solely from the line color. Wait for acceptance with renewed pressure or a separate reversal trigger.
Professional note and common misreads
Professional note
CVD on TradingView is estimated from available intrabar or directional volume rather than verified bid/ask aggressor flags. Compare filter modes out of sample and measure divergence persistence before assigning meaning.
Common misreads
- Calling the CVD estimate direct smart-money tracking.
- Shorting every bearish divergence while price keeps accepting higher.
- Changing filter mode until a historical turn looks perfect.
Practice it: Tag twenty price/CVD agreements and twenty divergences at fixed settings. Measure how long conflict persisted and what structural event resolved it.
14 supporting · order flow · Are momentum and flow patterns aligning?Nexural Transform
Combines transformed momentum with CVD and order-flow pattern detection.
- Reads
- Absorption, sweeps, failed auctions, exhaustion, divergence, and stacked imbalances.
- Use
- Use to add pattern evidence to an existing thesis.
- Best when
- You need transformed momentum plus pattern evidence such as absorption, exhaustion, sweep, or divergence.
- Pairs with
- Pair with a defined level and regime tool so detected patterns answer a specific thesis question.
- Failure
- Treating a pattern label as proof of hidden institutional intent or a guaranteed reversal.
- Boundary
- Detected patterns are not proof of hidden orders or guaranteed reversals.
How to use it
Nexural Transform combines transformed momentum with CVD and order-flow pattern labels to help you describe what may be happening at a planned level.
What you see
- The transformed oscillator shows momentum and stretch.
- CVD provides a directional participation layer when intrabar data is available.
- Labels identify absorption, sweeps, failed auctions, exhaustion, icebergs, and stacked imbalances.
What drives it
- Seven documented detection systems combine price, volume, delta, and session-aware thresholds.
- A confidence score aggregates factors; several detections may share underlying inputs.
- Pattern labels are hypotheses generated from observable data, not direct knowledge of participant identity.
Four-step workflow
- 1
Define the location and the exact pattern question before reading labels.
- 2
Compare the label with CVD, price result, and session conditions.
- 3
Demand persistence or confirmation instead of reacting to the first print.
- 4
Invalidate the pattern when price behavior contradicts its expected result.
An absorption label prints at support while negative delta increases but price stops falling.
- Read
- Effort is not producing further downside, which supports an absorption hypothesis.
- Decision
- Wait for buyers to produce an observable response. If support fails, the label did not create a valid reversal.
Professional note and common misreads
Professional note
Terms such as iceberg and smart money are inferential when the feed lacks order identifiers. Audit false positives and avoid presenting a classifier label as verified participant intent.
Common misreads
- Calling every label institutional proof.
- Ignoring feed limitations.
- Entering before price confirms the hypothesized pattern.
Practice it: Screenshot twenty pattern labels at decision time. Grade the label, confirmation, and failure separately after the session.
15 supporting · momentum · Is momentum aligned across timeframes?Quant RSI
Uses Laguerre filtering and adaptive thresholds across five timeframes.
- Reads
- Momentum alignment, volatility-adjusted extremes, ADX regime, volume, and divergence.
- Use
- Use for multi-timeframe momentum context.
- Best when
- You need multi-timeframe momentum alignment with thresholds that adapt to volatility and trend strength.
- Pairs with
- Pair with one location framework and avoid stacking it beside several tools derived from similar momentum.
- Failure
- Counting five correlated timeframe readings as five independent confirmations or fading every extreme.
- Boundary
- It does not replace structure, location, or an observable invalidation.
How to use it
Quant RSI organizes momentum across several timeframes and adapts its thresholds to volatility and trend conditions.
What you see
- Five timeframe readings show whether momentum agrees or conflicts.
- Adaptive overbought and oversold thresholds move with volatility.
- The condition label and 0–100 strength score summarize trend, volume, divergence, ADX, and alignment.
What drives it
- The documented oscillator uses a Laguerre filter to reduce lag.
- Timeframes include 5, 10, 15, 30, and 60 minutes in the knowledge base.
- The strength score combines related inputs, so alignment is not five independent signals.
Four-step workflow
- 1
Choose the decision timeframe before reading the alignment panel.
- 2
Identify agreement, conflict, or transition across the five views.
- 3
Interpret extremes through the ADX regime and price location.
- 4
Use one trigger and one risk plan instead of trading the composite score.
All five timeframes show bullish momentum, but price is extended above the planned target area.
- Read
- Alignment confirms the move that already happened; it does not improve the current entry geometry.
- Decision
- Do not chase. Wait for a new location and reassess whether alignment survives the pullback.
Professional note and common misreads
Professional note
Multi-timeframe inputs overlap heavily because larger bars contain smaller bars. Adjust statistical tests for dependence instead of treating each aligned timeframe as a separate observation.
Common misreads
- Counting five timeframes as five independent votes.
- Fading every extreme.
- Letting score strength override poor location.
Practice it: Record alignment at the same time each day for two weeks. Compare trend persistence, pullbacks, and transitions.
16 supporting · trend · What is the responsive trend state?Nexural JMA
Plots a responsive Jurik-style average with adaptive zones and strength.
- Reads
- Trend direction, ATR zones, momentum, volume, volatility, and trend strength.
- Use
- Use as a trend and dynamic-zone reference.
- Best when
- You need a responsive trend reference with adaptive zones and less visual noise than a simple average.
- Pairs with
- Pair with regime and location evidence; use JMA for trend state rather than a standalone crossover system.
- Failure
- Assuming responsiveness eliminates lag or that every color or slope change begins a durable trend.
- Boundary
- A moving-average cross is not sufficient evidence on its own.
How to use it
Nexural JMA is a responsive trend line with volatility-based zones. It helps you see trend state and dynamic structure without pretending a smoother can remove uncertainty.
What you see
- The JMA line and cloud show direction and visually encode trend strength.
- Zones at the documented 1.5 ATR distance provide dynamic structure around the average.
- Momentum, volume, volatility, and trend-strength scores support the displayed state.
What drives it
- The Jurik-style smoothing is designed to reduce lag and noise relative to conventional averages.
- Gradient opacity reflects a 0–100 trend-strength calculation.
- Entry labels require documented volume and strength confirmation beyond a simple cross.
Four-step workflow
- 1
Read the broader regime and price structure.
- 2
Observe slope, state, and distance from the JMA zones.
- 3
Wait for a planned interaction instead of trading every color change.
- 4
Use separate participation and invalidation evidence before execution.
JMA turns bullish after a sharp impulse while price sits outside the upper ATR zone.
- Read
- The trend state is bullish, but price is extended relative to the dynamic structure.
- Decision
- Keep the directional context and wait for a valid pullback or new base rather than buying the color change.
Professional note and common misreads
Professional note
Proprietary-style smoothing still lags and can overfit its visual appeal. Compare it with a simple baseline and measure whether the added complexity improves decisions after costs.
Common misreads
- Calling the line zero-lag in a literal sense.
- Entering every cross.
- Using dynamic zones as guaranteed support or resistance.
Practice it: Compare JMA and a simple moving-average baseline over fifty signals. Measure delay, false flips, and entry quality.
17 supporting · volatility · Is compression preparing to expand?ACE Squeeze
Detects volatility compression and release with cycle and regime adaptation.
- Reads
- Dominant cycles, volatility adjustment, delta confirmation, range expansion, and z-score quality.
- Use
- Use to prepare scenarios around compression and expansion.
- Best when
- You need to identify compression and prepare scenarios for a possible volatility expansion.
- Pairs with
- Pair with separate direction, location, and participation tools because compression does not choose a side.
- Failure
- Predicting breakout direction from the squeeze alone or entering before expansion receives confirmation.
- Boundary
- It does not predict breakout direction without separate directional evidence.
How to use it
ACE Squeeze tells you when volatility is compressed and when that compression may be releasing. It does not choose the breakout direction.
What you see
- Compression states show volatility contracting relative to the current cycle and regime.
- Three glow tiers label building, strong, and extreme expansion evidence.
- Heat bands, volume delta, and range expansion help grade the release.
What drives it
- The documented engine uses dominant-cycle timing, volatility-adjusted cycle detection, and relative range expansion.
- Z-score filtering grades statistical quality while regime logic changes sensitivity.
- Volume delta confirms participation after compression begins to release.
Four-step workflow
- 1
Identify compression before price breaks the planned structure.
- 2
Write bullish and bearish scenarios instead of predicting a side.
- 3
Wait for range expansion, direction, and participation to align.
- 4
Reject late entries when the release has already consumed the reward-to-risk.
A strong squeeze state appears beneath resistance with no directional break yet.
- Read
- Energy is compressed, but direction remains unresolved.
- Decision
- Prepare both scenarios and wait for price, participation, and risk geometry. Compression alone is not a long signal.
Professional note and common misreads
Professional note
Cycle estimates and z-scores depend on lookback and distribution assumptions. Validate release timing, direction conditioning, and late-signal frequency across regimes.
Common misreads
- Predicting direction from compression.
- Entering before expansion.
- Chasing after the range has already expanded.
Practice it: Log thirty squeeze releases with the pre-break structure, direction, participation, and distance traveled before confirmation.
18 supporting · regime · Is fear creating reversal evidence?QFA Pro
Scores potential bottoming conditions from several independent factors.
- Reads
- RSI divergence, support response, absorption, wick rejection, climax, and POC proximity.
- Use
- Use to rank reversal evidence after a defined selloff.
- Best when
- A defined selloff exists and you want to rank several independent pieces of potential reversal evidence.
- Pairs with
- Pair with profile support, structural invalidation, and verified participation before considering execution.
- Failure
- Calling a bottom from a high fear score while price, structure, or liquidity continues to deteriorate.
- Boundary
- A high score is not proof that a bottom has formed.
How to use it
QFA Pro ranks potential bottoming evidence after fear and selling pressure build. It helps organize a reversal hypothesis; it cannot announce the exact low.
What you see
- The 0–100 score combines peak, divergence, support, volume, POC, fear, and bonus evidence.
- Instant, building, and early tiers show how much of the configured threshold has accumulated.
- Support touches, absorption, wick rejection, climax, and divergence reveal which factors created the score.
What drives it
- Documented weights include 25 points for RSI divergence and 20 points for peak detection.
- Support can contribute 20–30 points, while volume events and fear bonuses add smaller increments.
- Several bonuses can arise from related selloff behavior, so a total score is not the count of independent causes.
Four-step workflow
- 1
Confirm that a defined selloff and meaningful support area exist.
- 2
Open the score components instead of reading only the total.
- 3
Wait for price response and participation to confirm that selling has stopped controlling the auction.
- 4
Place invalidation beyond structure and reject the idea if support fails.
QFA reaches a building tier near profile support, driven mostly by RSI divergence and a fear bonus.
- Read
- Potential reversal evidence is accumulating, but support response and volume absorption are still missing.
- Decision
- Keep observing. Do not front-run the score; require the missing independent evidence.
Professional note and common misreads
Professional note
A weighted score needs calibration and ablation testing. Measure each component’s incremental value and avoid calling the threshold a probability of a bottom.
Common misreads
- Calling a high score the bottom.
- Ignoring which components created the score.
- Averaging down while structure keeps failing.
Practice it: Break twenty QFA signals into component scores. Track which combinations preceded durable structure changes.
19 supporting · trend · How clean is the active trend?VHull Elite
Uses an adaptive Hull-style average with noise filtering and regime detection.
- Reads
- Trend state, volatility, quiet conditions, chop, and gradient strength.
- Use
- Use for trend-following context and noise reduction.
- Best when
- You need a noise-filtered trend lens that distinguishes active trend, quiet conditions, and chop.
- Pairs with
- Pair with QVS or Regime Matrix for environment and one location framework for actionable context.
- Failure
- Using a smooth line to ignore late entries, structural invalidation, or the possibility that the trend ends.
- Boundary
- Smoothing does not eliminate lag or guarantee a trend will persist.
How to use it
VHull Elite is a clean trend lens. It adapts smoothing and brightness to the market so you can distinguish directional movement from chop and quiet conditions.
What you see
- The Hull-style line shows direction while brightness reflects trend strength.
- Regime labels distinguish strong trend, trend, range, volatile chop, and quiet markets.
- The adaptive blend changes the balance between HMA and zero-lag EMA behavior.
What drives it
- A multi-stage noise filter aims to reduce whipsaw without making the line unresponsive.
- Volatility affects both adaptive length and the blend engine.
- The tool describes trend quality; it does not define where the next trade should begin.
Four-step workflow
- 1
Classify the displayed regime before using the line direction.
- 2
Compare gradient strength with higher-timeframe price structure.
- 3
Use a location framework to decide where a trend setup could make sense.
- 4
Reject the setup when chop, extension, or invalid risk geometry dominates.
VHull stays bright and bullish while price pulls into a fresh profile level.
- Read
- Trend quality supports the long-side scenario, and location now makes the idea worth observing.
- Decision
- Wait for timing and participation. VHull supports context; it does not pull the trigger.
Professional note and common misreads
Professional note
Adaptive smoothing trades lag against stability; it cannot remove both. Benchmark regime switches and whipsaw reduction against simpler trend filters.
Common misreads
- Buying because the line is bright.
- Ignoring late-entry distance.
- Assuming smoothing guarantees trend persistence.
Practice it: Tag fifty bars by VHull regime and compare them with your independent structure classification. Review every disagreement.
20 supporting · volatility · What volatility regime is active?QVS Pro
Combines seven volatility dimensions into a regime and entry-quality context.
No current profile card was matched in the August 23, 2026 TradingView snapshot. Confirm release and entitlement status with Sage.
- Reads
- ATR, volatility-of-volatility, range estimators, microstructure, term structure, and acceleration.
- Use
- Use to decide whether volatility supports the planned strategy.
- Best when
- You need several volatility dimensions to classify the environment before selecting a strategy or size.
- Pairs with
- Pair before entry tools so volatility regime influences the playbook, stop expectations, and restraint.
- Failure
- Treating an entry-quality score as an order signal or increasing size because volatility looks favorable.
- Boundary
- A high entry score is not an instruction to enter or increase size.
How to use it
QVS Pro describes the volatility environment. Use it to decide whether your strategy and risk assumptions fit current conditions before you look for an entry.
What you see
- Regime labels range from dormant and low through normal, high, and extreme.
- Seven dimensions expose realized volatility, volatility-of-volatility, range estimators, microstructure, term structure, and acceleration.
- The 0–100 entry score summarizes environment inputs but does not create an order.
What drives it
- The documented composite includes Garman–Klass, Parkinson, and Yang–Zhang style estimates.
- Kyle’s Lambda is used as a microstructure proxy alongside term-structure slope and volatility acceleration.
- The knowledge base describes NQ optimization and VIX integration, which limits automatic transfer to other markets.
Four-step workflow
- 1
Read the volatility regime before choosing a playbook.
- 2
Inspect which dimensions are driving the composite instead of using only the label.
- 3
Adjust scenario expectations and reject strategies that do not fit the regime.
- 4
Keep position size tied to independent risk and instrument behavior.
QVS moves from low to high as price approaches a planned breakout, but volatility-of-volatility is also accelerating.
- Read
- Expansion supports the breakout environment while unstable volatility warns that fills and stops may behave worse than usual.
- Decision
- Use the regime to tighten execution standards or reduce exposure; never increase size because the entry score is high.
Professional note and common misreads
Professional note
Composite volatility measures use different estimators with different assumptions. Validate normalization, correlation, and transferability outside NQ before relying on the total score.
Common misreads
- Trading the entry score.
- Ignoring the dimensions behind the total.
- Applying NQ-tuned behavior unchanged to every instrument.
Practice it: Compare QVS regimes with realized range, slippage, and stop behavior for thirty sessions in one market.
21 supporting · participation · Is directional imbalance consistent?DI Pressure Pro
Combines DI pressure, candle anatomy, and cumulative-delta approximation.
- Reads
- Directional index, body/wick imbalance, and cumulative pressure.
- Use
- Use as a compact directional-consistency check.
- Best when
- You need a compact consistency check across directional index, candle anatomy, and cumulative pressure.
- Pairs with
- Pair with verified location and timing evidence; use it as a supporting pressure layer, not the whole setup.
- Failure
- Confusing approximated order flow with tick-level truth or acting on pressure without invalidation.
- Boundary
- Approximated order flow cannot replace verified tick-level evidence.
How to use it
DI Pressure Pro gives you a compact read of directional pressure by combining DI, candle anatomy, and an order-flow approximation.
What you see
- DI pressure supplies half of the documented composite score.
- Candle body and wick imbalance contribute 30% of the score.
- The cumulative-delta approximation contributes the remaining 20%.
What drives it
- The composite weights directional index more heavily than candle anatomy or estimated delta.
- Candle-level structure approximates aggression when verified tick flow is not available.
- Because every layer is derived from the same bars, the score is a synthesis rather than three independent confirmations.
Four-step workflow
- 1
Define the higher-timeframe direction and planned location.
- 2
Compare DI pressure with candle efficiency and wick behavior.
- 3
Check whether cumulative pressure persists across several bars.
- 4
Use the score as support and require separate timing, risk, and invalidation.
DI pressure turns bullish, but candles close with long upper wicks and cumulative pressure fails to build.
- Read
- The composite contains conflict: directional index improved while candle result and persistence remain weak.
- Decision
- Do not promote the bullish state into a trade. Wait for efficient closes and persistent pressure at a valid level.
Professional note and common misreads
Professional note
The delta layer is an approximation, not a substitute for verified bid/ask or tick data. Benchmark it against real flow before using it for microstructure conclusions.
Common misreads
- Calling approximated flow tick-level truth.
- Reacting to one score change.
- Ignoring disagreement inside the composite.
Practice it: Record twenty DI Pressure state changes and write which component led each one. Compare the result with verified flow when available.
No indicators match that filter.
Build a non-redundant stack
Add tools by question, not by visual appeal. Several momentum indicators agreeing may still represent one underlying input.
- 01Environment
Choose one regime or volatility tool.
- 02Location
Use Volume Profile, QWAP, ORB, or another location framework.
- 03Timing
Use QPulse or one momentum tool for the trigger.
- 04Participation
Use Flow Pro or one order-flow tool for confirmation.
- 05Risk
Define entry, stop, target, invalidation, and size independently.
Validate before trusting a tool
An indicator earns a place in your process only after you define its claim and test it against data it could not see during development.
Define the exact market, timeframe, session, and decision the indicator supports.
Write the signal rule so another person can reproduce it.
Include fees, slippage, latency, and realistic fills in testing.
Separate development, validation, and forward-test periods.
Measure false positives, missed signals, drawdown, and regime dependence.
Retire or revise the tool when live evidence contradicts its intended job.