Handbook / Indicators / QPulse
QPulse
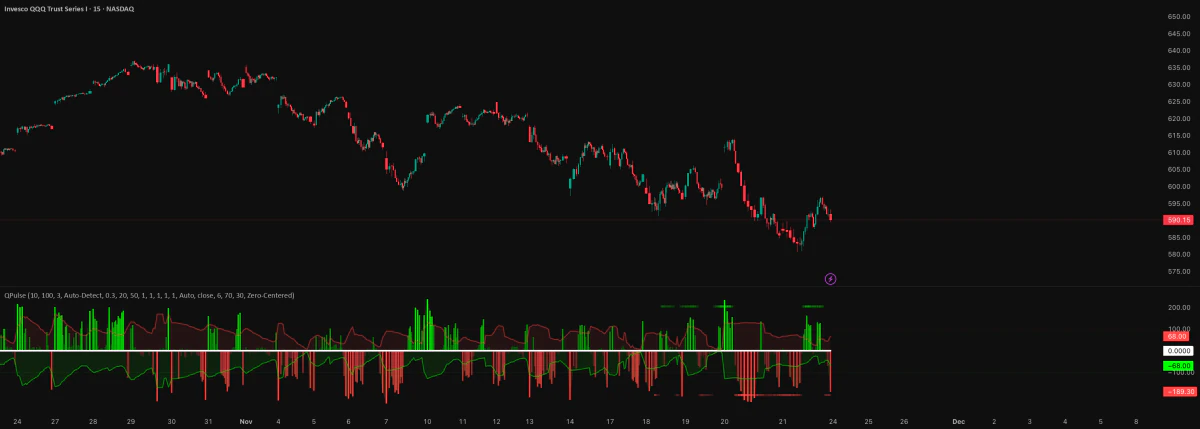
A color bar chart that shows push, strength and calm or wild moves once price is at your level.
In one sentence
QPulse is the clock. It shows the push, its strength, and how calm or wild price is once price reaches a level you already planned.
Why it matters
This is the "When" tool in STS, the Sage Trading System. You use it only after price is at your level. See Step 2: When.
Green and red bars show which way price is pushing and how hard. When the bars cross the zero line, the push has changed sides. A brighter bar means a stronger push, not a surer trade. Bands show if price is coiling up, breaking out, or already stretched too far.
It comes after Volume Profile and before Flow Pro.
Do this
- Check that price is at a real level from Volume Profile or the chart's structure.
- Decide if QPulse is early, on time, late, stretched, or missing.
- Watch the first one to three candles that answer. Do not chase candle four.
- Send the idea to Flow Pro and then to your risk check before you act.
Real example
This is a teaching example, not a real trade.
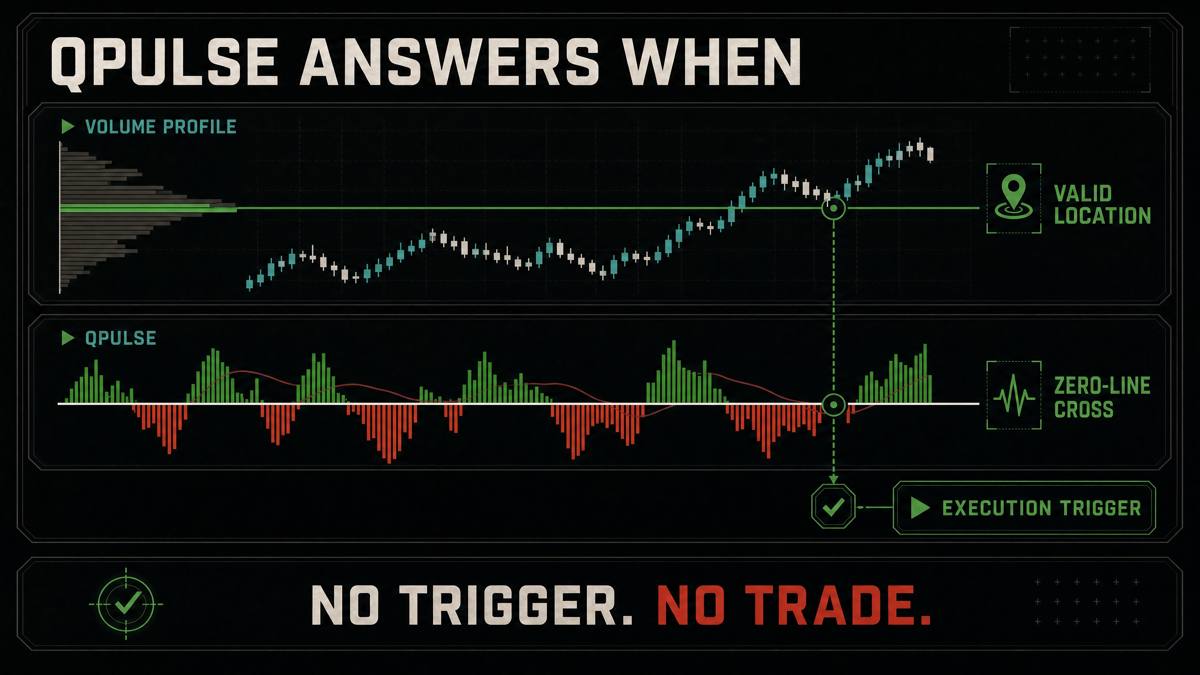
Price tests a planned buy zone. QPulse is deep below zero and starts to climb toward it. The selling may be running out, but this is only timing that is still forming. Wait for the cross and a quick answer from price, then check Flow Pro. If the answer comes late or flow stays dead, pass.
Common mistakes
- Scanning QPulse first, then making up a level after the signal shows.
- Taking a brighter color as a reason to trade bigger.
- Buying after the move is stretched because the bars still look strong.
- Chasing a cross after price has left your level.
What it can't do
It cannot turn a poor level into a good one. It cannot set your risk. It cannot make a late move early again. Its parts share inputs, so do not count them as separate votes.