Handbook / Indicators / Nexural Volume Profile
Nexural Volume Profile
A map of where the most trading happened, so you know which prices to watch.
In one sentence
Volume Profile is your map of the trading day. It shows where price was accepted, where it moved fast, and which old prices may matter again.

Why it matters
This is the "Where" tool in STS, the Sage Trading System. You use it first. It marks the prices worth watching before price gets there. See Step 1: Where.
The point of control (POC) is the price with the most trading. The value area high (VAH) and value area low (VAL) are the top and bottom of the zone that holds about 70% of the trading. Busy prices are high volume nodes (HVNs). Thin prices are low volume nodes (LVNs), and price may cross them fast. If the POC moves from day to day, value is moving. If the zones overlap, the market is in balance.
It does not pick a side. Timing comes next, from QPulse. Then Flow Pro checks if real buyers or sellers show up.
Do this
- Pick the session and range that fit the choice you are making.
- Before price gets there, mark the POC, VAH, VAL, the key busy and thin prices, and any fresh zone.
- Check if today's value sits inside, overlaps, or sits apart from the last session.
- At your marked price, wait for timing and real buying or selling. Only then plan your risk.
Real example
This is a teaching example, not a real trade.
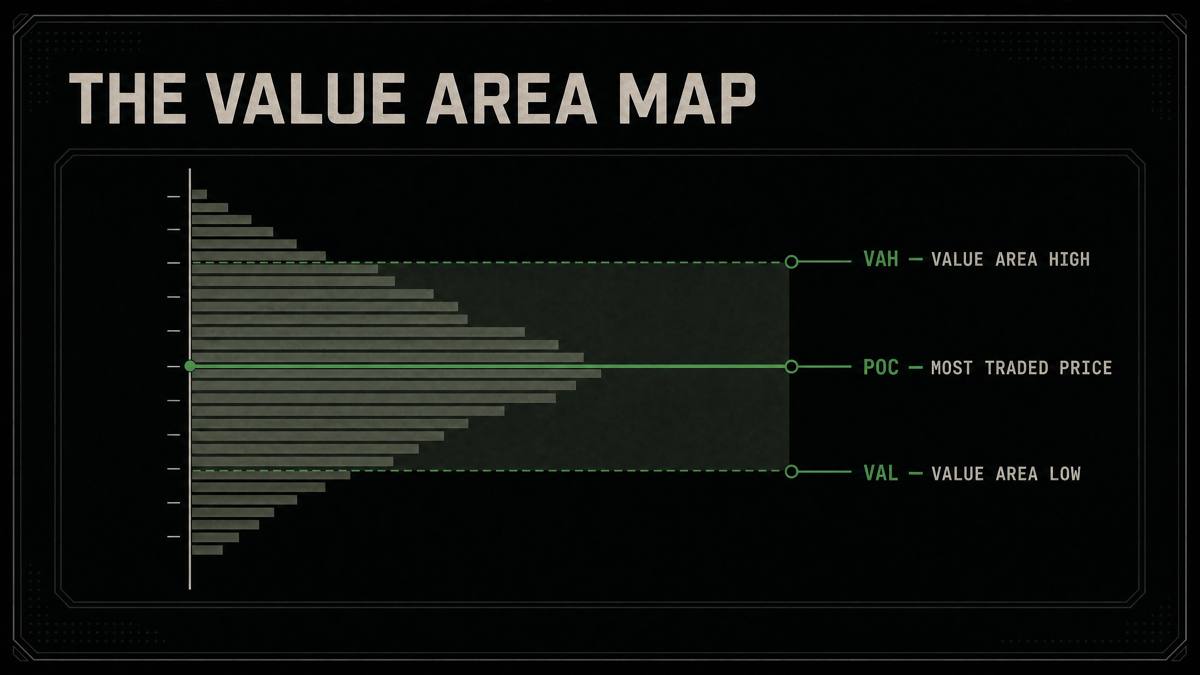
Price comes back to the VAL after a morning inside the last session's value area. The VAL is worth watching. The overlap hints at balance, but it does not prove the VAL will hold. Mark the price and wait for QPulse timing and Flow Pro. Pass if price settles below the VAL or the risk does not fit.
Common mistakes
- Buying every VAL touch, or selling short every VAH touch.
- Treating every level as a sure floor or ceiling for price.
- Calling an untested POC a sure magnet that price must visit, and soon.
- Moving the profile range until it agrees with the trade you already want.
What it can't do
It does not give you a direction or an entry by itself. The levels change with the range, session, row size and data you pick. No level is a sure entry or a sure bounce.