Handbook / Indicators / Nexural Trend Finder
Nexural Trend Finder
Shows the trend and an early read on whether buying or selling is building behind it.
In one sentence
Trend Finder shows the trend fast. It also gives an early read on whether trading is building before the lines fully turn.
Why it matters
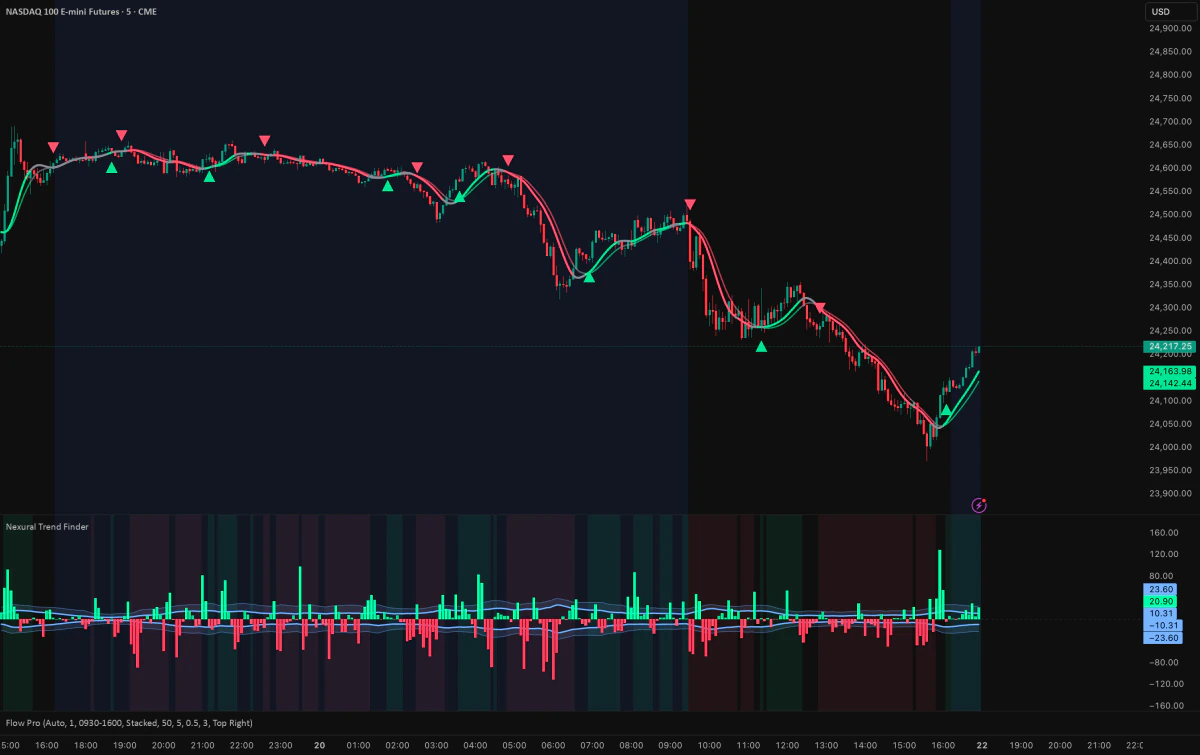
Use it for trend context, not as an entry. Two lines do the work. They are JMA lines, a kind of smooth moving average (an average of recent prices). The fast line uses 7 bars and the slow line uses 9 by default. When the fast line crosses the slow one, the trend state flips.
A bar chart below mixes buy and sell pressure, how busy trading is, candle body size, and where each candle closes. Bands based on ATR (average true range, the normal size of a bar) widen and shrink as price gets wilder or calmer. When the bars break outside the bands, trading is unusually strong for now. Pair it with a way to find levels, like Volume Profile, and your own risk plan.
Do this
- Read the bigger timeframe's structure before you look at the trend state.
- Compare the two lines with the bar chart below.
- Check if trading activity and price swings back the trend or warn of noise.
- For any real trade, use a separate level, trigger, and risk rule.
Real example
This is a teaching example, not a real trade.
The fast line turns above the slow line and the bars get stronger. But price is already far above the nearest level you planned. The trend is getting better, but the entry spot and the reward for the risk are still poor. Note the bullish context and wait for a planned pullback. Do not chase the flip.
Common mistakes
- Buying or selling every time the lines cross.
- Thinking the bar chart predicts the next candle.
- Ignoring a poor entry spot because the trend score is high.
- Counting the bar chart's parts again as extra proof. They are already mixed into one score.
What it can't do
It does not predict the next price move. "Zero lag" is a design goal, not seeing the future. The bar chart is not true trade-by-trade buy and sell data, and not every cross is a trade.