Handbook / Indicators / Nexural MTF Pro
Nexural MTF Pro
Puts up to three bigger timeframes on the chart you trade from, so you stop switching charts.
In one sentence
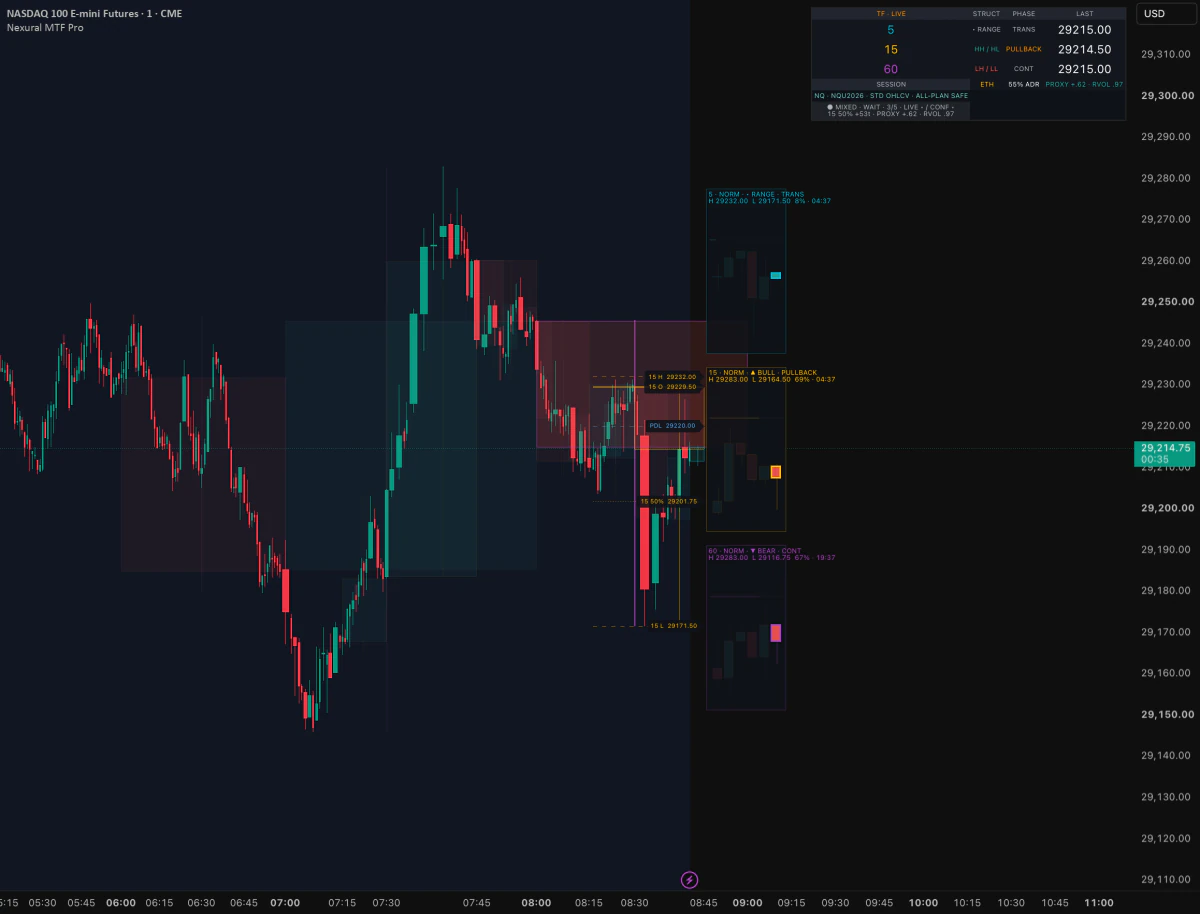
MTF Pro keeps the bigger picture on the chart you trade from. MTF means multi-timeframe, so it shows up to three larger timeframes at once.
Why it matters
You often trade on a small chart, like 3 minutes. But the 15, 60 or 240 minute charts can tell a different story. MTF Pro shows their candles, structure, phase, and key session prices in small panels.
Some parts need care. A LIVE bigger candle is still forming and can change. A CONFIRMED one has closed. Labels mark swing points, a break of structure (BOS, price breaking a past swing), and a change of character (CHoCH, a first sign the trend may turn). Session rails mark prices like the prior day high and the overnight range.
The panel also gives a confirmed score. It needs at least 80% of the checks that are available to agree. That is a rule-based label, not a win rate. The pressure reading is a guess from price and volume. It is not true order flow.
Do this
- Use normal candles. Pick bigger timeframes that match how long you hold a trade.
- Pick the right session preset, or write down your custom session. Check your data delay, symbol, and contract roll dates.
- Keep LIVE apart from CONFIRMED. Then compare the confirmed structure, phase, and session rails with the setup you planned.
- Treat agreement or conflict as context only. You still need your own trigger, exit point, size, and max loss.
Real example
This is a teaching example, not a real trade.
On a 3 minute chart, a setup points long. The 15, 60 and 240 minute panels look bullish too. But price is pushing into the prior day high, near the top of the daily range. The bigger charts agree on direction, but the spot makes a late buy weaker. Wait for price to hold above that rail and give a fresh trigger. Or pass if the stop and target no longer fit. Do not buy just because the score is high.
Common mistakes
- Treating a LIVE bigger candle as if it had closed.
- Reading the confirmed score as an 80% win rate or an order signal.
- Calling the pressure guess true order flow or proof of who is trading.
- Using the wrong session or odd chart types, then trusting the rails and structure anyway.
What it can't do
The score is not a chance of winning. The pressure layer is a guess, not true order flow. Confirmed swing points show up late, and the bigger candle that is still forming can change.