Handbook / Indicators / CVD Trendline
CVD Trendline
A trend line and cloud that show when price and estimated buying pressure agree or split.
In one sentence
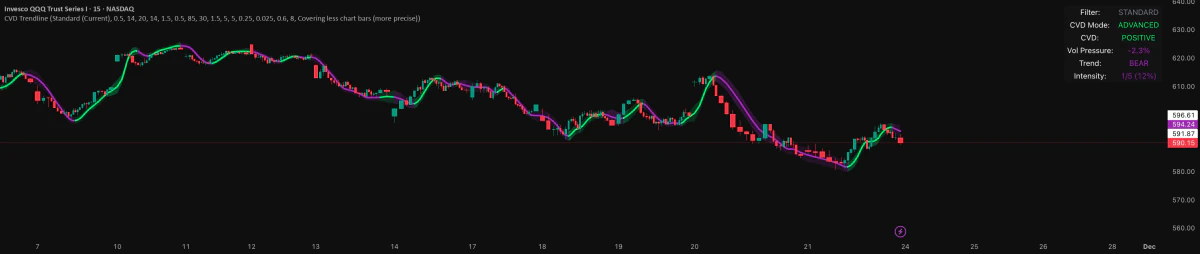
CVD Trendline mixes a price trend line with CVD. It helps you see when price and estimated buying or selling pressure agree, fade, or split apart.
Why it matters
CVD is cumulative volume delta, a running total of buying volume minus selling volume. Here it is an estimate. The center line shows the trend. The cloud around it grows or fades with the strength of that pressure.
You can pick from three filter modes: Standard, Kalman-style, and Butterworth-style. Each trades speed for smoothness in its own way. It also shows divergence, when price and CVD point different ways, plus a Laguerre momentum reading and a panel. When smaller-bar data is there, the tool uses it to split volume better. With less detail in the history, the split is rougher.
Use it after you know the bigger structure and your level.
Do this
- Pick one filter mode. Write down why it fits the market and time frame you study.
- Read the trend and cloud strength only after the bigger structure and your level are clear.
- Treat agreement between price and CVD as support. Treat divergence as a reason to look closer or trust the idea less.
- You still need a clear trigger and your own risk plan before you trade.
Real example
This is a teaching example, not a real trade.
Price presses into an old ceiling. The line stays bullish, but the cloud fades and a bearish divergence shows up. Price is still going up, but the pressure no longer backs it as strongly. That is conflict, not proof to sell short. Do not buy a late move just from the line color. Wait for price to hold with new pressure, or for a separate reversal trigger.
Common mistakes
- Calling the CVD estimate a way to track "smart money."
- Selling short on every bearish divergence while price keeps holding higher.
- Changing filter modes until an old turn looks perfect.
What it can't do
The CVD here is an estimate, not true buyer and seller data. A divergence does not promise a reversal, and it can last a long time.