Handbook / Indicators / Nexural OrderFlow Matrix
Nexural OrderFlow Matrix
A heat map that packs each candle's volume and buying versus selling into one row.
In one sentence
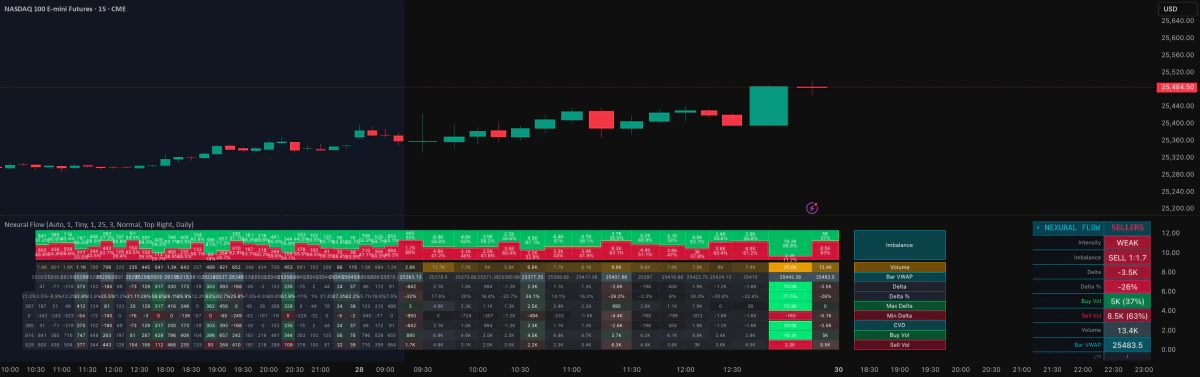
OrderFlow Matrix packs each candle's volume and buying versus selling into a heat map. You can read it without opening many panels.
Why it matters
Each bar can show volume, buy volume, sell volume, delta (buying minus selling volume), delta as a percent, the bar's VWAP (volume weighted average price), and CVD (the running total of delta). Stacked bars show which side won inside the candle. Busy bars glow. Quiet bars fade to gray, so a loud color on a thin bar does not fool you.
It sums each bar. It does not show every trade at every price, the way a footprint chart does. Use it for detail at a level you planned, with a level tool like Volume Profile.
Do this
- Mark your level and your bigger chart idea first.
- Look at several rows next to each other, not one lone cell.
- Compare delta, activity, and what price did. Look for a push that lasts, or for absorption, when effort gives little result.
- Use the read as support. Plan the trade outside the matrix.
Real example
This is a teaching example, not a real trade.
One bright cell with strong buying shows up at a ceiling. The rows around it are quiet and mixed. That one cell shows activity. It does not show buyers taking control. Wait for the push to repeat and for price to follow. One bright square does not earn a trade.
Common mistakes
- Trading the brightest cell.
- Ignoring the bars next to it.
- Treating the bar totals as a full footprint chart.
- Skipping a check on the data quality.
What it can't do
A single bright cell is not enough for a trade. The matrix uses TradingView's smaller-bar volume, not raw trade data or full order book depth. Adding up each bar hides the order of trades inside it.