Handbook / Indicators / Nexural Fisher Pro
Nexural Fisher Pro
Shows when price is stretched and turning, read differently in trends and ranges.
In one sentence
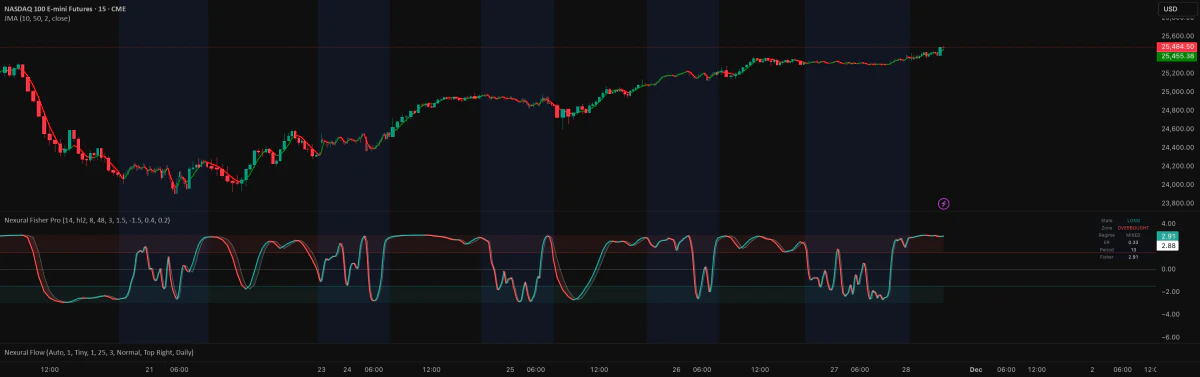
Fisher Pro shows when price is stretched and starting to turn. What that means changes between a range and a trend, so the type of market comes first.
Why it matters
It is built on the Fisher Transform, a math step that turns price into a line with clear high and low extremes. The line stays between about minus three and plus three. Crosses and turns show a change in push. Its length adjusts to the main price cycle.
Volume weighting and market labels help split range reversals from trend moves. Overbought means price is high in its recent range. Oversold means it is low. Fisher Pro reads these zones in a different way in trends and ranges. Use it after you already know your level, from a tool like Volume Profile or QWAP.
Do this
- Decide if the market is trending or in a range.
- Find where the Fisher line sits against its stretch zones.
- Wait for the right cross or trend move at a price level that matters.
- Check separate structure and volume before you set your risk.
Real example
This is a teaching example, not a real trade.
Fisher turns up from oversold. But price is in a strong downtrend and below value. The line is stretched, but in a strong trend a snap-back idea is weak. Do not buy the extreme alone. Wait for a real change in structure and volume, or treat the turn as a pause in the downtrend.
Common mistakes
- Treating oversold as a buy signal.
- Ignoring the type of market.
- Counting Fisher and a similar tool as two separate pieces of proof.
- Selling short because the line is high, or buying because it is low, while a strong trend keeps going.
What it can't do
Overbought does not mean price must fall. Oversold does not mean it must rise. An extreme does not require a quick turn. Tools that adapt can also look cleaner in hindsight than they felt live.