Handbook / Indicators / Quant RSI
Quant RSI
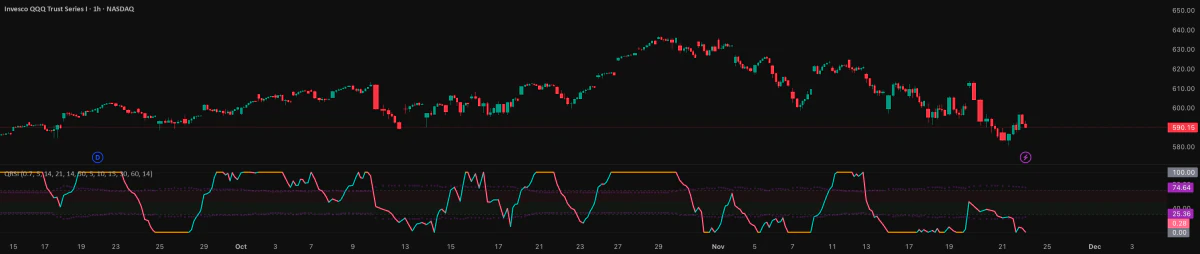
Shows push across five timeframes, with high and low zones that adjust to the market.
In one sentence
Quant RSI lines up push across several timeframes. Its high and low zones adjust to how wild the market is and how strong the trend is.
Why it matters
RSI is the relative strength index, a common push reading. This version uses a Laguerre filter to cut delay. It shows five timeframes: 5, 10, 15, 30, and 60 minutes. You can see if they agree or clash.
Its overbought and oversold zones move with price swings. A label and a 0 to 100 strength score sum up trend, volume, divergence, ADX (a trend strength reading), and how well the timeframes agree. Pair it with one level tool, like Volume Profile. Avoid stacking it next to other tools built from the same kind of push data.
Do this
- Choose your decision timeframe before you read the panel.
- Spot agreement, conflict, or change across the five views.
- Read extremes through the ADX reading and where price is.
- Use one trigger and one risk plan. Do not trade the score.
Real example
This is a teaching example, not a real trade.
All five timeframes show bullish push. But price is already stretched above the target area you planned. The agreement confirms a move that already happened. It does not make the entry better now. Do not chase. Wait for a new level and see if the agreement holds through the pullback.
Common mistakes
- Counting five timeframes as five separate votes. Bigger bars contain smaller bars, so they overlap.
- Betting against every extreme.
- Letting a strong score override a poor level.
What it can't do
It does not replace structure, a price level, or a clear exit point. The timeframe readings can move together. Any chance-of-winning wording on the public page is not proven results.