Handbook / Indicators / Nexural JMA
Nexural JMA
A fast, smooth trend line with zones that widen and shrink with price swings.
In one sentence
Nexural JMA is a fast trend line with zones based on price swings. It helps you see the trend without pretending smoothing removes doubt.
Why it matters
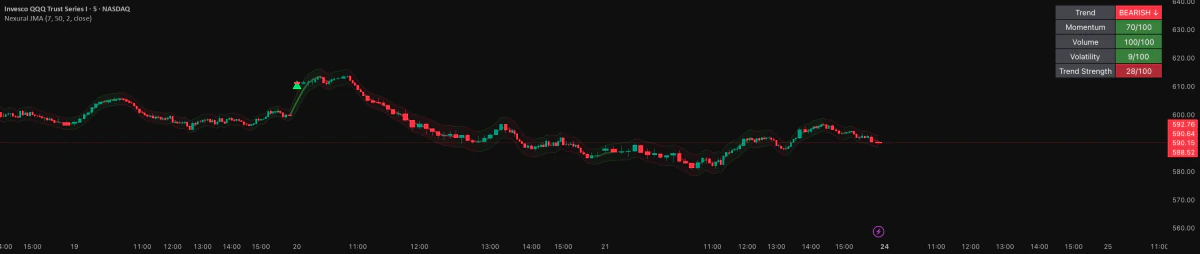
JMA stands for a Jurik-style moving average, an average of recent prices built to cut delay and noise. The line and its cloud show direction. The fade of the color shows a 0 to 100 trend strength score.
Zones sit 1.5 ATR away from the line. ATR is average true range, the normal size of a bar. They give moving support and resistance around the average. Scores for push, volume, price swings, and trend strength back up the state. Entry labels need volume and strength, not just a cross.
Pair it with a type-of-market tool and a level tool. Use it for the trend state, not as a stand-alone cross system.
Do this
- Read the bigger market type and price structure.
- Watch the slope, the state, and how far price is from the zones.
- Wait for a planned touch. Do not trade every color change.
- Get separate volume proof and an exit point before you trade.
Real example
This is a teaching example, not a real trade.
JMA turns bullish after a sharp jump. Price sits outside the upper zone. The trend is bullish, but price is stretched far from the line. Keep the bullish view and wait for a real pullback or a new base. Do not buy the color change.
Common mistakes
- Calling the line truly "zero lag."
- Taking every cross.
- Treating the zones as a sure floor or ceiling.
- Thinking every color or slope change starts a lasting trend.
What it can't do
A cross on its own is not enough proof. A fast average still lags price. The panel score mixes related inputs. It is not separate proof and not a win rate.