Handbook / Indicators / ACE Squeeze
ACE Squeeze
Shows when price swings are squeezed tight and when that squeeze may be releasing.
In one sentence
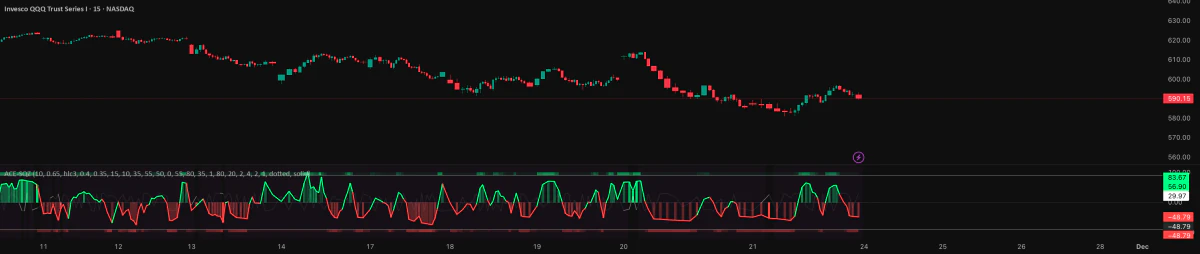
ACE Squeeze shows when price swings are squeezed tight and when that squeeze may be letting go. It does not pick the breakout direction.
Why it matters
Volatility is how much price swings. When it shrinks, the market is coiling. When it grows, price is breaking loose. This tool marks the squeeze in light of the current price cycle and type of market.
Three glow levels mark building, strong, and extreme release. Heat bands, volume delta (buying minus selling volume), and bigger bars help grade the release. A z-score, a measure of how unusual a reading is, grades its quality. Pair it with separate tools for direction, level, and volume, because a squeeze does not choose a side.
Do this
- Spot the squeeze before price breaks the structure you planned.
- Write both a bullish and a bearish plan. Do not guess a side.
- Wait for bigger bars, a clear direction, and volume to line up.
- Skip late entries when the move has already used up the reward for the risk.
Real example
This is a teaching example, not a real trade.
A strong squeeze shows up just below a ceiling. Price has not broken out yet. Energy is coiled, but the direction is still open. Get both plans ready and wait for price, volume, and your risk to line up. A squeeze alone is not a buy signal.
Common mistakes
- Guessing direction from the squeeze.
- Trading before the release.
- Chasing after the range has already grown.
What it can't do
It does not choose the breakout direction, timing, stop, or size. False releases still happen. Its cycle and z-score readings depend on the lookback you set.